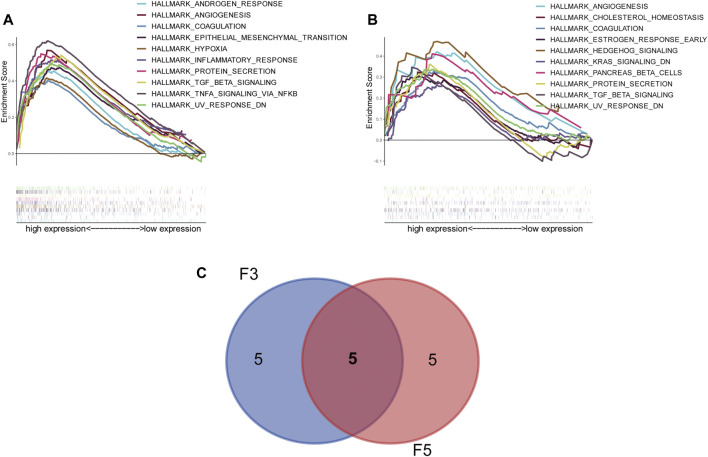
FIGURE 7.
Gene set enrichment analysis (GSEA) reveals the correlation of the D-dimer-related gene expression with several HALLMARK pathways. (A) Multi-GSEA constructed within F3 (high vs. low). (B) Multi-GSEA constructed within F5 (high vs. low). (C) Venn plot displaying the overlapping pathways of F3 and F5—namely, angiogenesis, coagulation, protein secretion, TGF beta signaling and UV response down.

