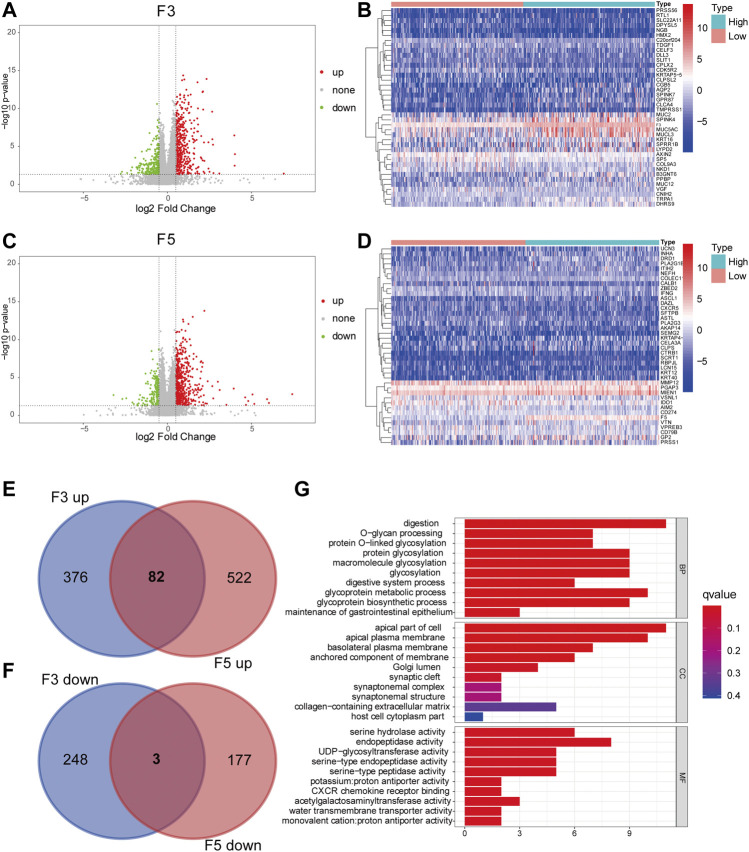
FIGURE 8.
GO enrichment of overlapping DEGs. (A) Volcano plot of the DEGs of F3 (high and low). p < 0.05 was the cutoff criterion for DEG significance, and an absolute value of log2-fold change>0.5 was considered significant. The red dots represent genes that are upregulated, the green dots represent genes that are downregulated, and the black dots resemble genes that are nonsignificant. (B) Heatmap depicting the top 20 upregulated and downregulated genes with F3 high and low expression. A higher fold change is depicted with a redder color. (C) Volcano plot of the DEGs of F3 (high and low expression), similar to (A). (D) Heatmap depicting the top 20 upregulated and downregulated genes with F5 high and low expression, similar to (B). (E–F) Venn plot displaying the overlapping genes of F3 and F5. (G) GO plot illustrating different enriched pathways of overlapping DEGs.

