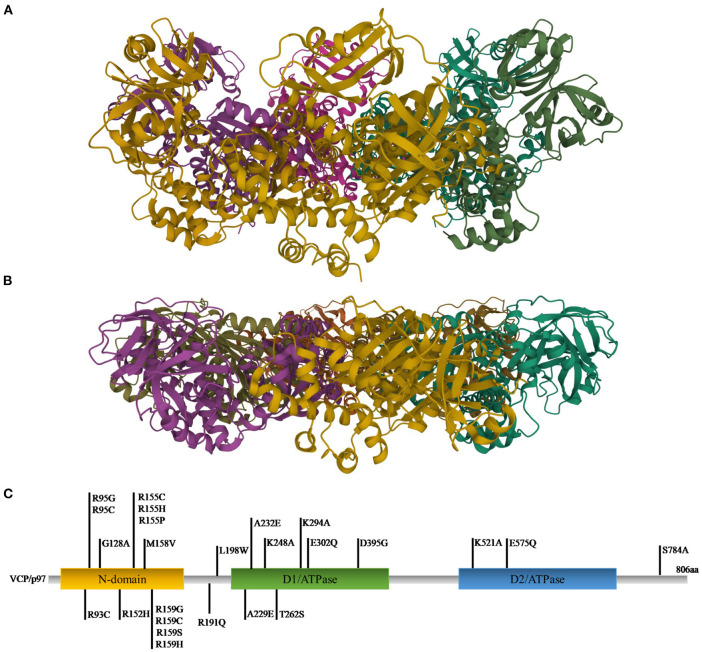
Figure 1.
Ribbon diagram representations of X-ray structures of VCP in the up (A) and down (B) states [PDB ID code 4KO8 (122) for the up state and 1E32 (123) for the down state]. (C) Gene representation with the indication of the three main domains and the relative mutations (C-terminal domain was omitted).

