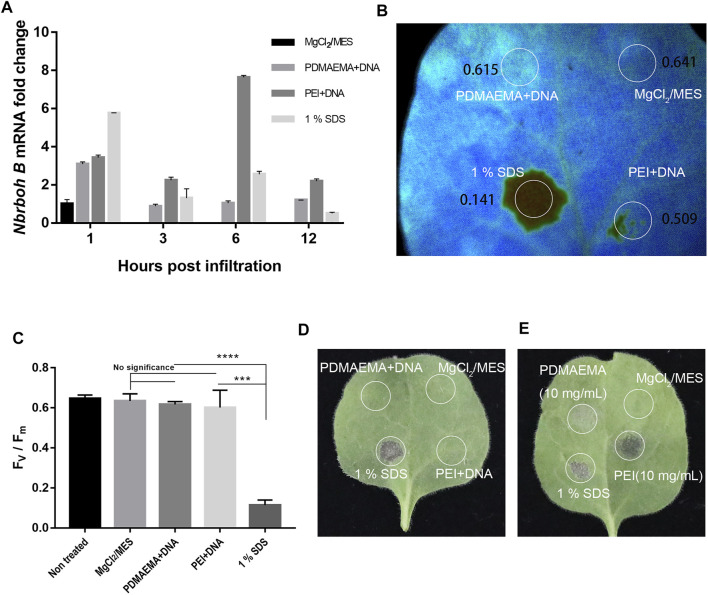
FIGURE 6.
Toxicity assay. (A) qPCR analysis of Nbrboh B in Nicotiana benthamiana leaves with different infiltrations (MgCl2/MES (10 mM) as control, PDMAEMA + DNA (N/P ratio of 15:1), PEI + DNA (N/P ratio of 15:1), and 1% SDS at a time course. (B) Photosystem II Fv/Fm of different locations treated with PDMAEMA + DNA (N/P ratio of 15:1), PEI + DNA (N/P ratio of 15:1), 1% SDS, and MgCl2/MES (10 mM) as control on the same Nicotiana benthamiana leaf. (C) Statistical data of the (B) Fv/Fm ratio represent the variable/maximum fluorescence measurement of the photosystem II quantum efficiency. (D) Phenotype of the single Nicotiana benthamiana leaf infiltrated with MgCl2/MES (10 mM), PDMAEMA + DNA (N/P ratio of 15:1), PEI + DNA (N/P ratio of 15:1), and 1% SDS on different positions. (E) Phenotype of a single Nicotiana benthamiana leaf infiltrated with MgCl2/MES (10 mM), 1% SDS, PDMAEMA (10 mg/mL), and PEI (10 mg/mL) on different positions.

