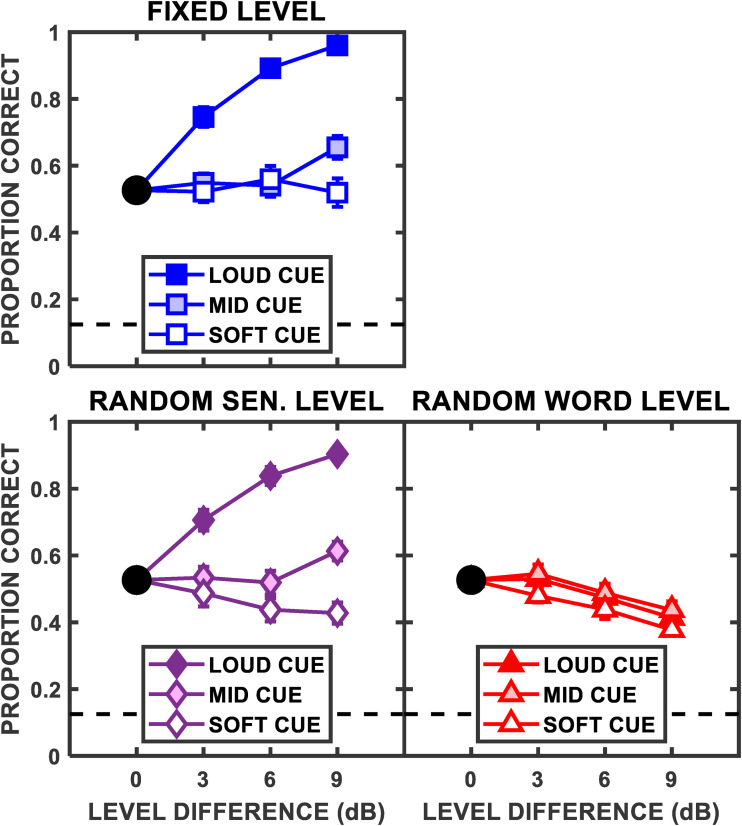
Figure 2.
Group mean speech identification results for the three different amounts of target talker level uncertainty, shown in separate panels. The level difference between the three simultaneous talkers forms the x-axis in each panel, while the y-axis is the mean proportion correct performance, with SEM error bars. Within each panel, the separate functions indicate the conditions where the target cue word was at the Loud, Mid, or Soft relative levels (solid, shaded, and open symbols, respectively). For the Random Word Level condition, each function contains target words from all levels with the percent correct values computed based on the cue word level of each trial (see text). The dashed horizontal line represents chance performance.

