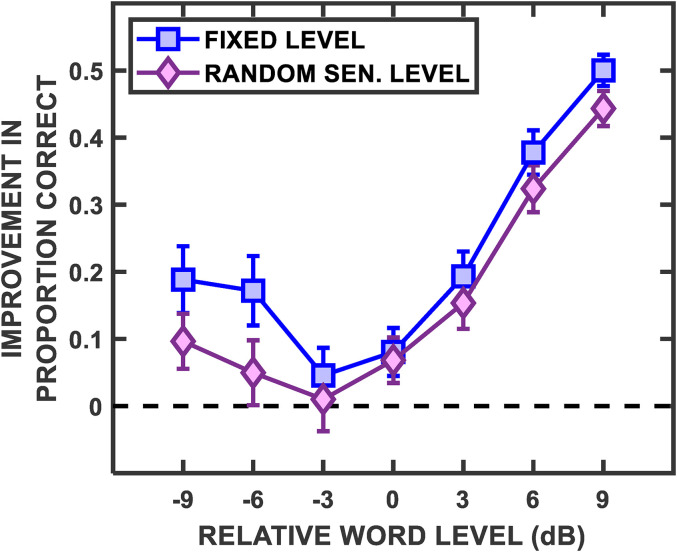
Figure 8.
The improvement in proportion correct for the Fixed Level and Random Sentence Level conditions relative to the Random Word Level condition is plotted as a function of the relative level of the target speech. The values are the group mean differences in proportion correct and SEM error bars.

