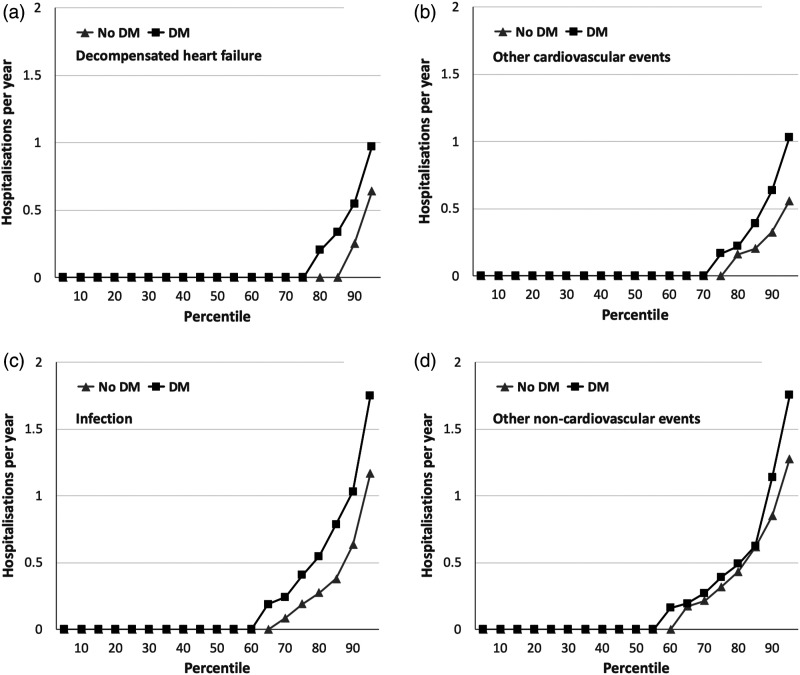
Figure 2.
Cause-specific hospitalisation rates in people with and without DM. Rates of cause-specific hospitalisation per year across percentiles of populations with (black squares) or without (grey triangles) diabetes mellitus (DM), illustrating the greater rate of hospitalisation in people with DM for decompensated heart failure (panel A; p = 0.003), other cardiovascular events (panel B; p = 0.043) and infection (panel C; p = 0.003), which was not observed for other non-cardiovascular events (panel D; p = 0.44).

