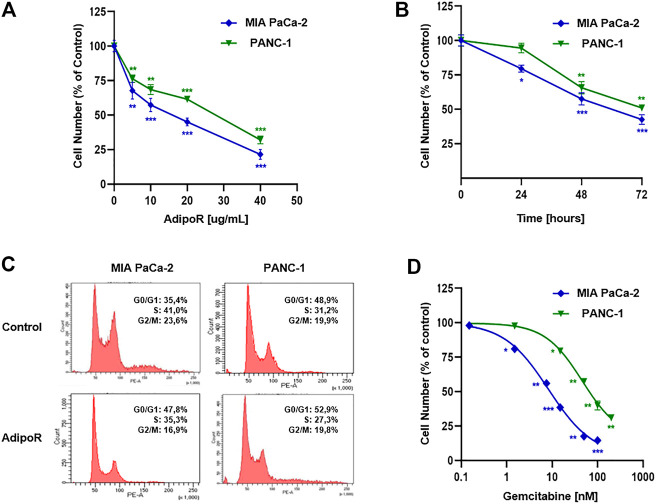
FIGURE 1.
Evaluation of single drug-mediated effects in PDAC cells. (A) MIA PaCa-2 and PANC-1 cells were exposed for 48 h to increasing AdipoR concentrations (10–40 µg/ml). (B) Cell growth curves were established in reaction to 10 µg/ml AdipoR over a period of 72 h. (C) Representative cell cycle profiles were obtained in MIA PaCa-2 and PANC-1 cells treated and not (control) with 10 µg/ml AdipoR for 24 h. (D) Dose effect induced by 48 h of Gem administration in MIA PaCa-2 and PANC-1 cells. In each experimental condition, the relative cell number was estimated in triplicate and expressed in figure as % of control. *p < 0.05, **p < 0.01, ***p < 0.001 by unpaired Student’s t-test.

