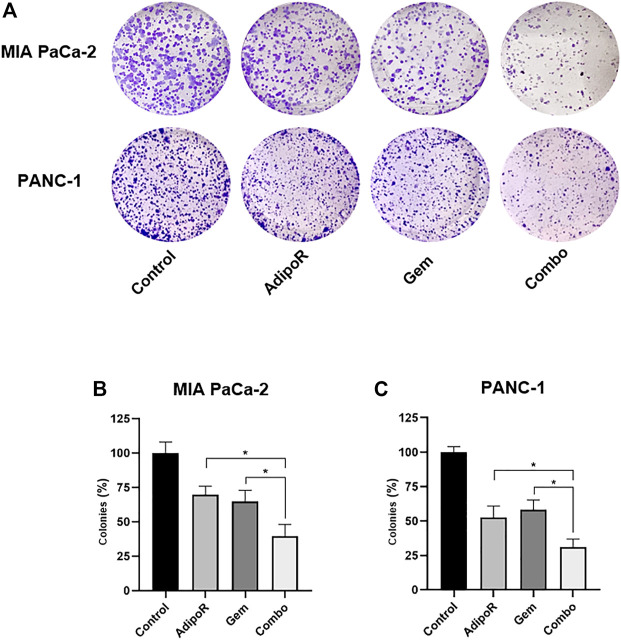
FIGURE 3.
Estimation of single and combinatory impacts on clonogenic potential in PDAC cells. MIA PaCa-2 and PANC-1 were treated and not (control) with the same AdipoR concentration (2 µg/ml) but different Gem amounts (4 vs 6 nM), both individually and in combination, for 8 and 10 days, respectively. Representative stained wells are displayed in (A), while the relative quantification analysis has been reported in (B) (MIA PaCa-2) and (C) (PANC-1). Experiments were reproduced thrice and plotted on a graph as mean value ± SD in % of control. *p < 0.05 by Tukey’s multiple comparisons test.

