FIGURE 4.
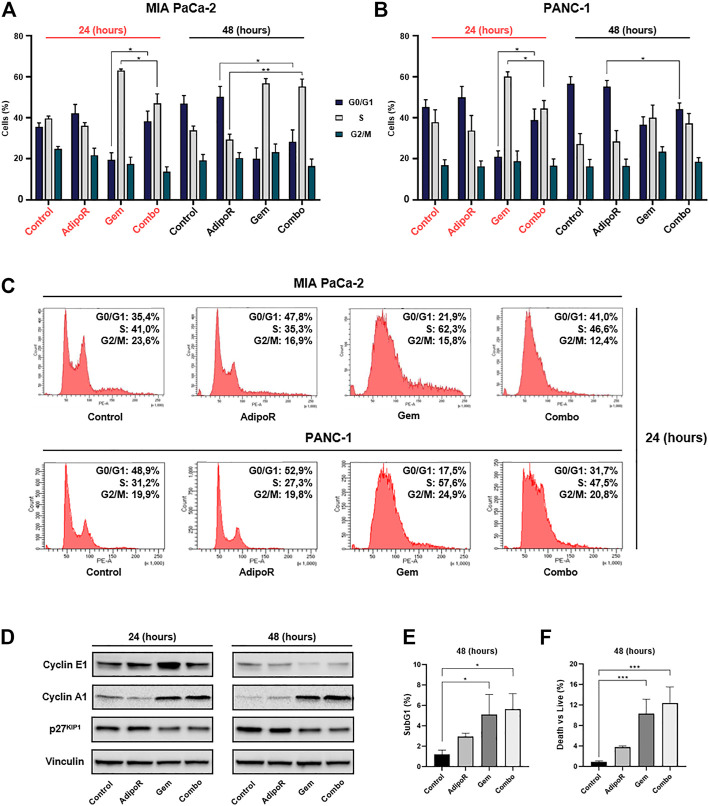
Investigation of single and combinatory consequences on cell cycle distribution in PDAC cells. MIA PaCa-2 was exposed and not (control) to 10 µg/ml AdipoR, 15 nM Gem, and AdipoR plus Gem over a period of 24 and 48 h (A). PANC-1 cells, instead, were treated and not (control) with 10 µg/ml AdipoR, 50 nM Gem, and combination for the same temporal extension (B). Subsequently, the relative cell phase distribution was defined by FACSCelestaTM using PI as DNA staining. MIA PaCa-2 and PANC-1 representative histogram plots at 24 h (C). (D) Cyclin A1, cyclin E1, and p27KIP1 expression levels were obtained in reaction to 10 µg/ml AdipoR, 15 nM Gem, and combination in MIA PaCa-2. (E) Relative subG1 amount. (F) Trypan blue discrimination analysis. Either (E) or (F) show MIA PaCa-2 results cultured in media containing AdipoR, Gem, and AdipoR plus Gem under the same (B) experimental conditions. Displayed data are expressed in percentage as average value ± SD of three independent experiments. *p < 0.05, **p < 0.01, ***p < 0.001 by Tukey’s multiple comparisons test.

