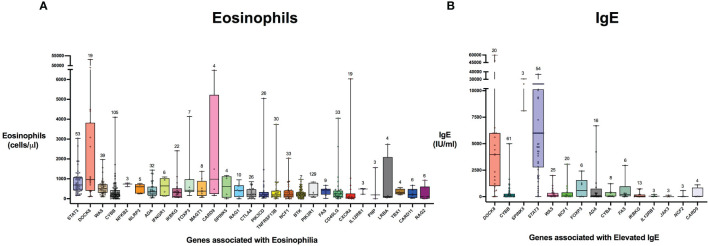
Figure 5.
Distribution of laboratory values in inborn errors of immunity associated with type 2 inflammation compared to the reference population. The genes are ordered by adjusted p-value from lowest to highest for eosinophil count (A) and IgE level (B). For each gene, the box plot spans the interquartile range between the upper and lower quartile, with the median laboratory value marked by the black horizontal line across the colored box plot. The whiskers on either side of the box plot show the minimum and maximum laboratory values. The value above each whisker indicates the number of patients for each IEI that were evaluated for eosinophilia or IgE. HGNC gene symbols used.

