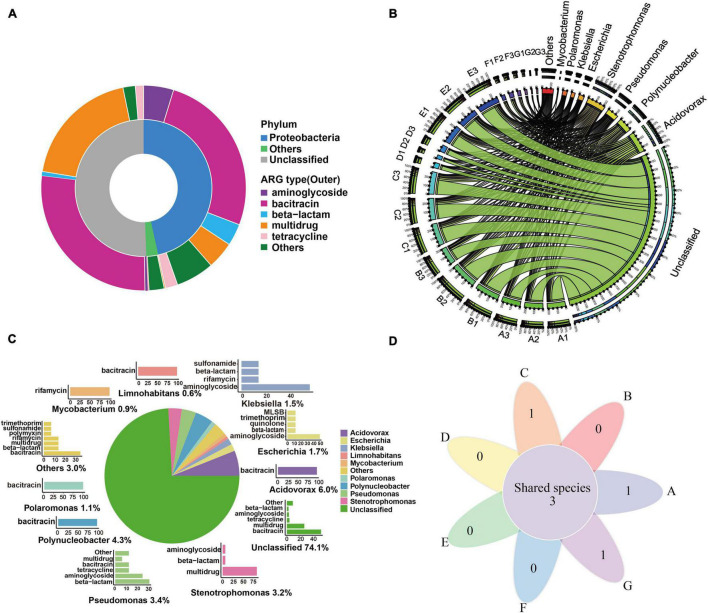
FIGURE 4.
ARG hosts analysis in the DWTS. (A) Annotation of ARG-carrying contigs at the phylum level. (B) The circle diagram shows the taxonomy and proportion of putative ARG hosts in DWTS. (C) The taxonomy of ARG-carrying contigs (in the genus level) and the percentages of ARG types these contigs carried. a: Pie chart shows the taxonomy and percentage of ARG-carrying contigs. For example, Acidovorax (6.0%) denotes that 6.0% of ARG-carrying contigs were annotated as Acidovorax. b: Bar chart shows the percentages of ARGs types that were carried by the annotated ARG-carrying contigs. The percentage of these annotated ARG-carrying contigs was set as 100%. For example, 100% of the ARG-carrying contigs originating from Acidovorax spp. carried bacitracin resistance genes. (D) Venn diagrams showing the number of shared species that carried ARG subtypes in DWTS bulk water and sand biofilm. A1–A3: raw water; B1–B3: flocculation tank effluent; C1–C3: sedimentation tank effluent; D1–D3:quartz sand; E1–E3: sand filter effluent; F1–F3: chlorine-disinfected water; G1–G3: tap water. Three samples were taken from each sampling site.

