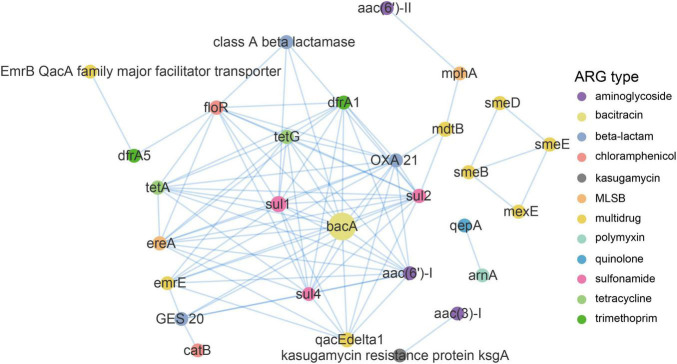
FIGURE 6.
Network analysis demonstrating the co-occurrence patterns of ARG subtypes in the DWTS. The nodes were colored according to network modularity, and the node size is proportional to the number of connections (degree). An edge is a strong (ρ > 0.8) and significant (p-value <0.01) connection between nodes.

