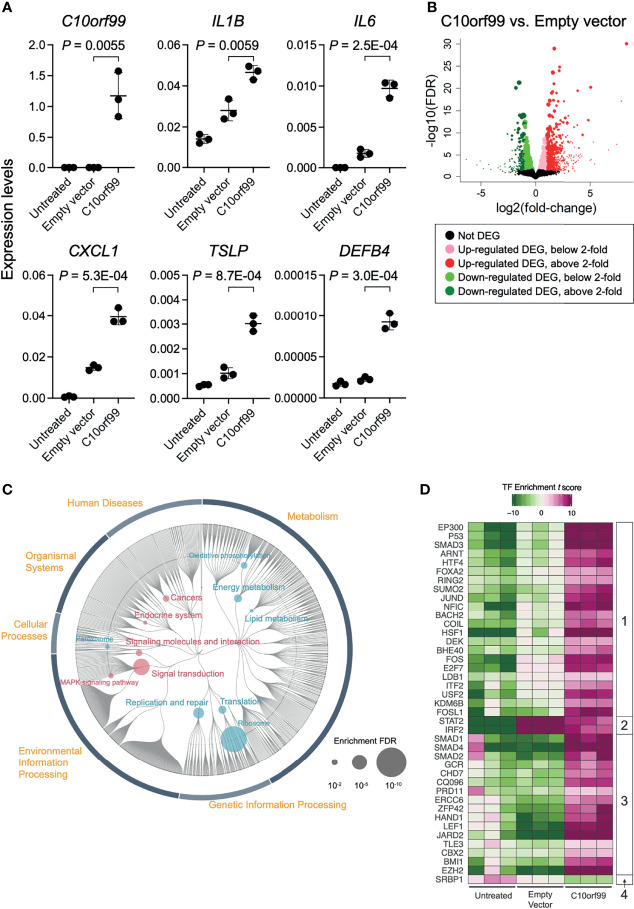
Figure 3.
Gene expression profiles in normal human epidermal keratinocytes (NHEKs) transfected with C10orf99. (A) Quantitative RT-PCR analysis of mRNA levels in untreated NHEKs transfected with empty vector or with C10orf99. The results were normalized to GAPDH expression levels (error bars, SD; n = 3). (B) Volcano plots of the relative differences in gene expression levels using the differentially expressed genes (DEGs) in NHEKs transfected with empty vector or C10orf99 and analyzed by RNA-seq analysis. Each point represents a unique gene, and the size of a point is proportional to the average absolute expression level of the gene (log2 CPM) over all samples. (C) Parametric enrichment analysis of the DEGs. The analysis was based on the KEGG functional hierarchy. (D) Transcription factor (TF) enrichment analysis of DEGs. The analysis was based on ChIP-seq data. The TFs were divided into four groups based on their changes in the enrichment t scores.

