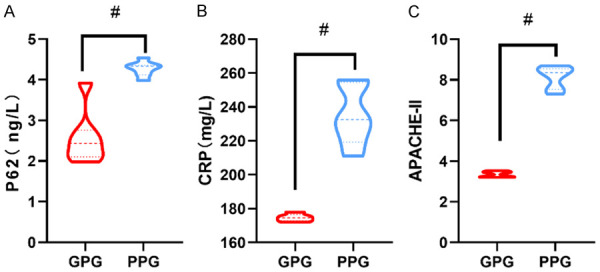
Figure 2.

Differences in P62, CRP and APACHE-II among patients with different prognosis. A: P62 levels; B: CRP levels; C: APACHE-II scores. CRP: C-reactive protein; APACHE-II: Acute Physiology and Chronic Health Evaluation II. #represents P<0.05 compared with the good prognosis group. The applied statistical method was t test.
