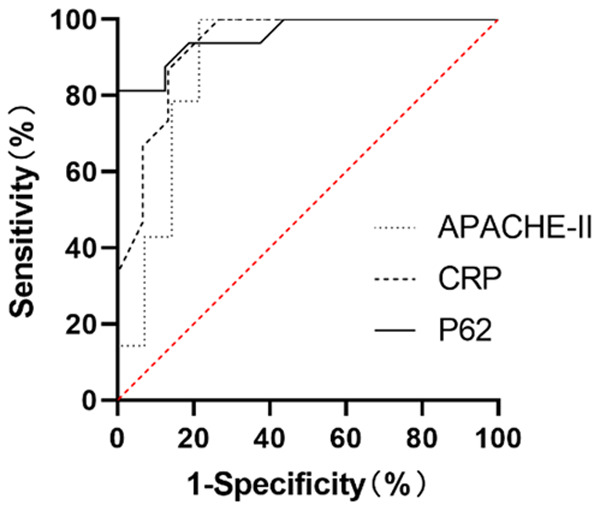
Figure 6.

ROC curves of serum P62 AP patients with poor prognosis. Serum AUC of P62: 0.9570 (95% CI=0.8939-1.000, P<0.0001); AUC of CRP: 0.9311 (95% CI=0.8388-1.000, P<0.0001); AUC of APACHE-II: 0.8827 (95% CI=0.7416-1.000, P<0.0001). The applied statistical method was ROC curve analysis.
