
Figure 3.
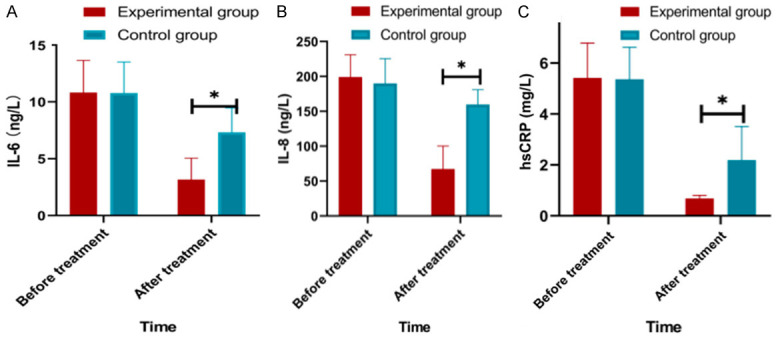
Comparison of serum levels of inflammatory factors between groups before and after intervention. A: Comparison of serum levels of IL-6 between the two groups before and after intervention; B: Comparison of serum levels of IL-8 between the two groups before and after intervention; C: Comparison of serum levels of hsCRP between the two groups before and after intervention; Note: Compared to experimental group, *P<0.05.