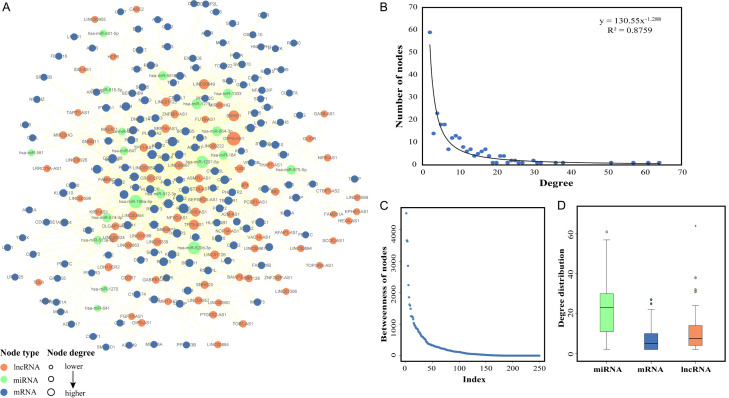
Figure 6.
Construction of MCEN by DEmRNAs and analysis of topological properties. A. The MS specific ceRNA network (MCEN). Bule nodes represent mRNAs, green nodes represent miRNAs, orange nodes represent lncRNAs and lines between them represent their interactions, the bigger the node is, the higher degree the node has. B. The nodes degree distribution of the MCEN. C. The nodes betweenness distribution of the MCEN. D. The degree distribution of miRNAs, mRNAs and lncRNAs in MCEN.

