Figure 2.
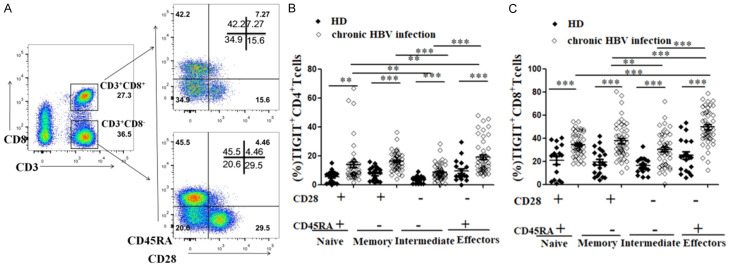
Expression of TIGIT is elevated at different stages of T cell differentiation in patients with chronic HBV infection. After thawing of frozen PBMCs, TIGIT expression on CD4+ and CD8+T cell subsets with different CD28 and CD45RA expression was detected. A. Representative flow cytometry flow plots show CD28 and CD45RA co-expression on CD4+ and CD8+T cells in chronic HBV infected patients. B. Graph shows compiled percentage of TIGIT+T cells in different CD4+T cell subsets in HD and chronic HBV infection groups. HBV-uninfected healthy donors (HD, black diamond; n=20), chronic HBV infection (open diamond; n=50). C. Graph shows compiled percentage of TIGIT+T cells in four CD8+T cell subsets in HD and chronic HBV infection groups. HBV-uninfected healthy donors (HD, black diamond; n=20), chronic HBV infection (open diamond; n=50). P values were calculated using independent-samples t test.

