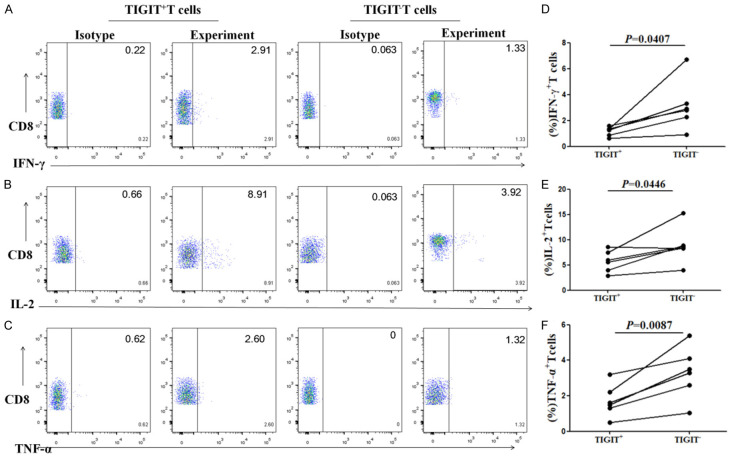
Figure 3.
Secretion of IFN-γ, TNF-α, and IL-2 by TIGIT+CD8+T cells is lower than that of TIGIT-CD8+T cells after stimulation of HLA-A2-restricted HBV peptides. Representative flow cytometry flow plots show percentage of (A) IFN-γ, (B) IL-2, and (C) TNF-α expression on TIGIT+ and TIGIT-CD8+T cells after stimulation of HLA-A2-restricted HBV peptides. Graphs show the compiled percentage of (D) IFN-γ, (E) IL-2, and (F) TNF-α expression in TIGIT+ or TIGIT-CD8+T cells after stimulation of HLA-A2-restricted HBV peptides in chronic HBV infection group (n=6). P values were calculated using independent-samples t test.

