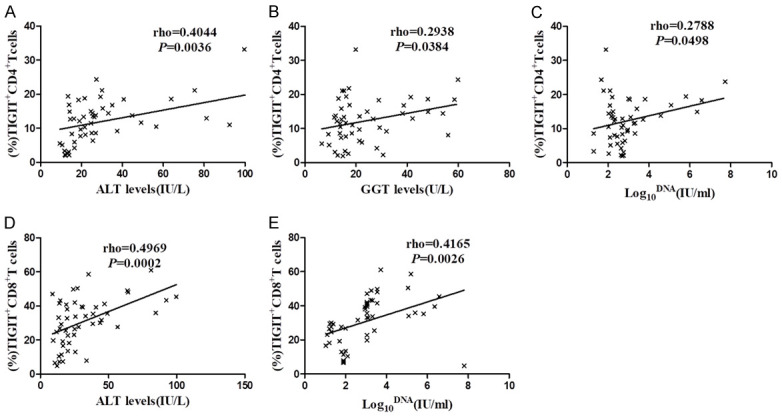
Figure 5.

Relationship between the expression of elevated TIGIT on T cells and clinical parameters in patients with chronic HBV infection. Graphs show correlation between the percentage of TIGIT+CD4+T cells and (A) ALT (IU/L) levels, (B) GGT (U/L) levels, and (C) HBV viral load (log10 IU/ml) levels in chronic HBV infection group (n=50). Graphs show correlations between the percentage of TIGIT+CD8+T cells and (D) ALT (IU/L) levels, and (E) HBV viral load (log10 IU/ml) levels in chronic HBV infection group (n=50). Spearman’s rho tests were performed to detect correlations.
