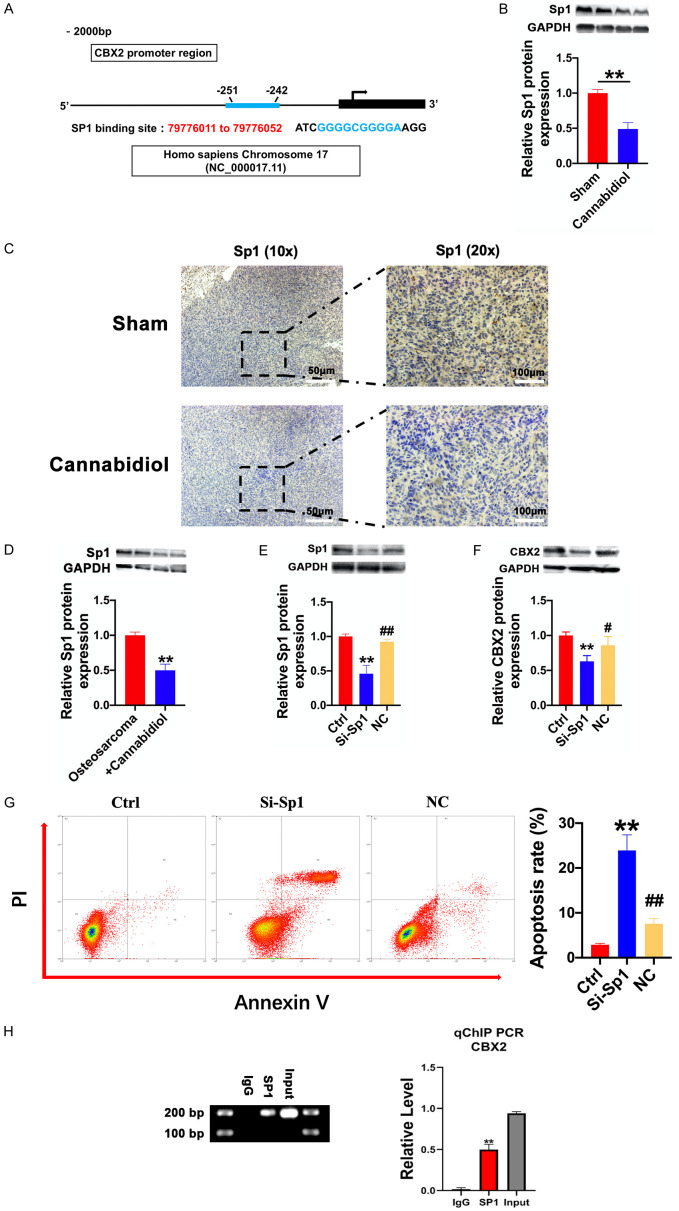
Figure 7.
SP1 positively regulates CBX2 protein expression by binding to the CBX2 promoter. A. Conservative SP1 DNA binding sites in the CBX2 DNA promoters. The sequences of these putative binding sites in the proximal region (2000 bp upstream) of CBX2 promoters are shown in the PROMO database. B. The protein expression of SP1 in tumor tissues of the sham and cannabidiol groups. n=6 for each group. **P<0.01 vs. Sham. C. Immunohistochemical results of SP1 in a mouse osteosarcoma model. Scale bar: 100 µm. D. The protein levels of SP1 in MG63 cells of the osteosarcoma and osteosarcoma + cannabidiol groups. n=4 for each group. **P<0.01 vs. osteosarcoma group. E. SP1-siRNA transfection efficiency in MG-63 cells; expression of SP1 protein in MG63 cells transfected with SP1-siRNA. **P<0.01 vs. Ctrl; ##P<0.01 vs. SP1-siRNA. Data are presented as mean ± SEM. F. The protein levels of CBX2 in MG63 cells of Ctrl, SP1-siRNA, and NC groups. n=6 for each group. **P<0.01 vs. CtrL; #P<0.05 vs. SP1-siRNA. Data are presented as mean ± SEM. G. The apoptosis of MG63 cells in Ctrl, SP1 siRNA, and NC groups was analyzed by flow cytometry. Representative images (left) and the ratio (right) of apoptotic cells in Ctrl, SP1-siRNA, and NC groups. The annexin V-positive/PI-negative and annexin V-positive/PI-positive fractions were plotted. The columns represent the mean ± SD of three independent experiments. n=3 for each group. **P<0.01 vs. Ctrl; ##P<0.01 vs. SP1-siRNA. H. The binding of SP1 to the proximal promoter regions of CBX2 DNA in MG-63 cells was determined using ChIP and quantitative chromatin immunoprecipitation (qChIP) assays. All values were initially expressed relative to relevant IgG DNA content. **P<0.01 vs. IgG.

