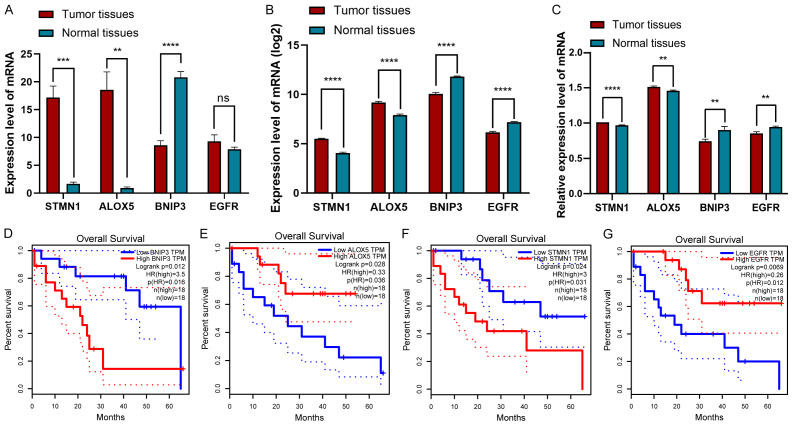
Figure 5.
A-C. Differential mRNA expression levels of the four DEFRGs in CHOL and normal tissues. A. Data from the TCGA. B. Data from the GEO. C. Ten pairs of fresh CHOL specimens and adjacent normal tissue specimens from the First Affiliated Hospital of Chongqing Medical University. D-G. The overall survival curve of CHOL patients based on the expression of BNIP3, ALOX5, STMN1 and EGFR.

