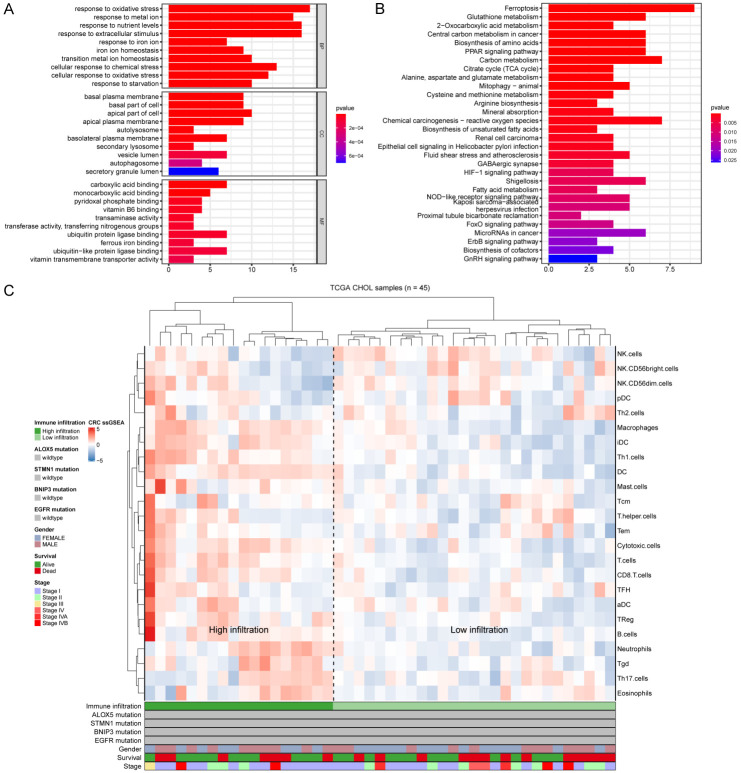
Figure 7.
(A, B) Functional enrichment analysis of the 65 DEFRGs in CHOL, showing the top 10 enriched BP, CC and MF (A), and KEGG pathways (B). (C) The 45 patients from the TCGA-CHOL cohort were clustered using single-sample gene set enrichment analysis scores from 24 immune cell types. The mutation statuses of ALOX5, STMN1, BNIP3 and EGFR, sex, survival, and stage are shown in the lower panel. High infiltration and low infiltration were defined by hierarchical clustering analysis.

