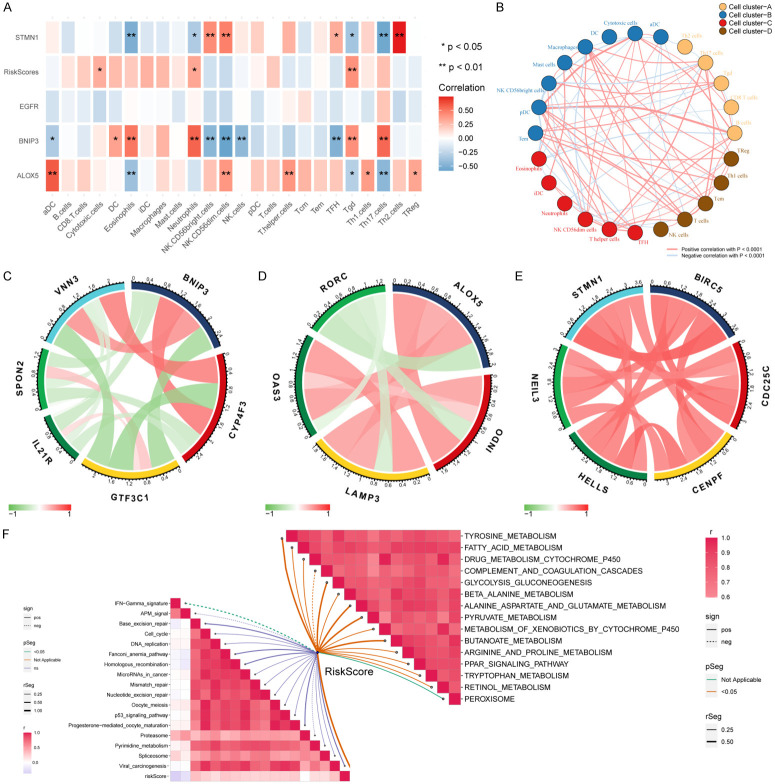
Figure 8.
(A) Correlations between the DEFRGs, riskScore, and 24 immune cell types; blue boxes indicate negative correlations, and red boxes indicate positive correlations. *represents P<0.05, **represents P<0.01. (B) Cluster analysis of 24 immune cell types, which were divided into four categories. Red line indicates positive correlation, blue line indicates negative correlation. (C-E) Correlations between BNIP3, ALOX5, STMN1 and immune biomarkers in the TCGA-CHOL cohort. (F) Correlations between riskScore and immunotherapy-predicted pathways (left half of F) and correlations between riskScore and enriched pathways of the gene sets in CHOL (right half of F).

