
Figure 9.
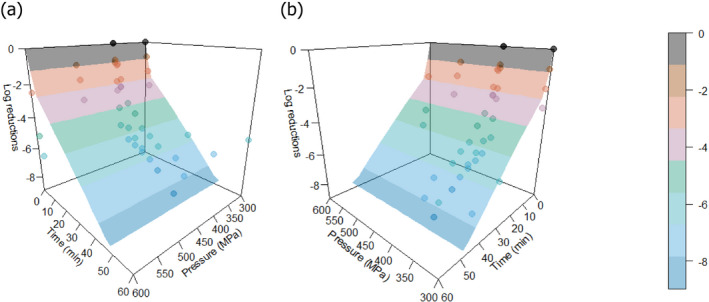
Observed (points) and predicted (response surface) log10 reductions of Salmonella spp. in response to pressure (P, MPa) and holding time (min), in various milk types
Official websites use .gov
A
.gov website belongs to an official
government organization in the United States.
Secure .gov websites use HTTPS
A lock (
) or https:// means you've safely
connected to the .gov website. Share sensitive
information only on official, secure websites.
Observed (points) and predicted (response surface) log10 reductions of Salmonella spp. in response to pressure (P, MPa) and holding time (min), in various milk types