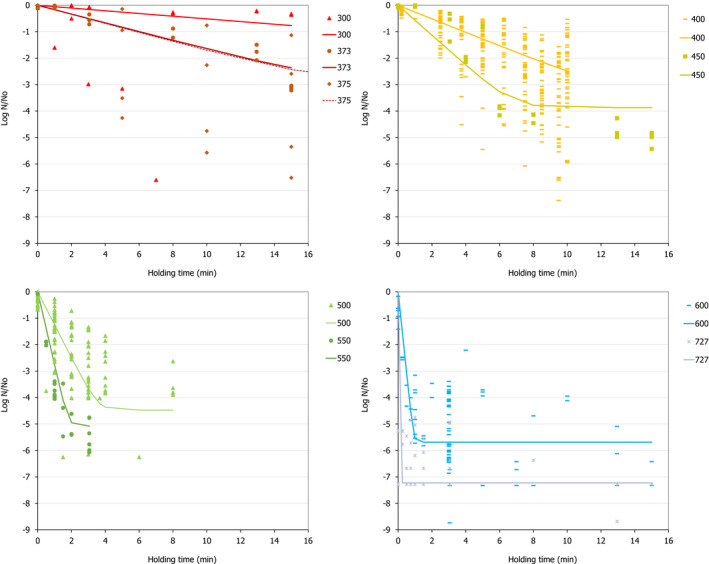
Figure 29.

Observed log10 reduction data (dots) for cooked meat products and the simulation of HPP inactivation (lines) according to the model developed by Hereu et al. (2012b)

Observed log10 reduction data (dots) for cooked meat products and the simulation of HPP inactivation (lines) according to the model developed by Hereu et al. (2012b)