
Figure 30.
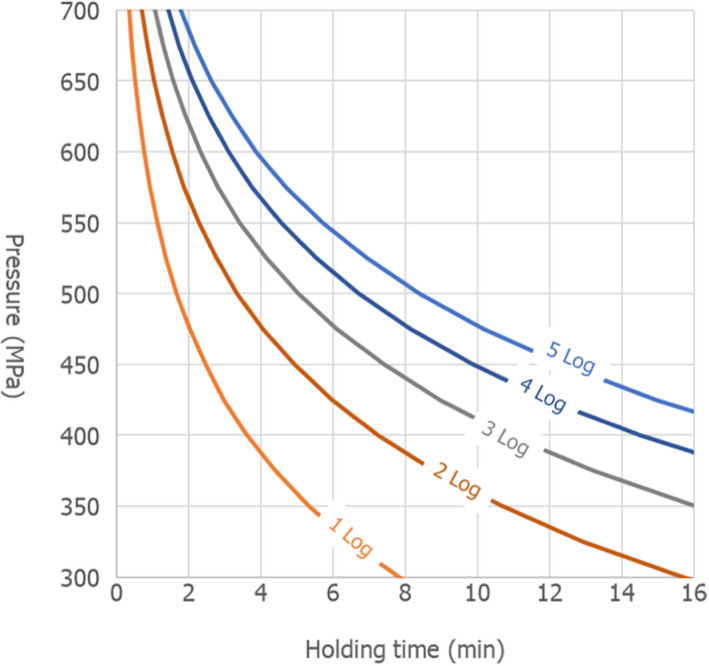
Isoreduction (log10 units) diagrams showing the combination of pressure and holding time for HPP causing a given number of log10 reductions for L. monocytogenes as predicted by the predictive model developed in Santillana Farakos and Zwietering (2011)