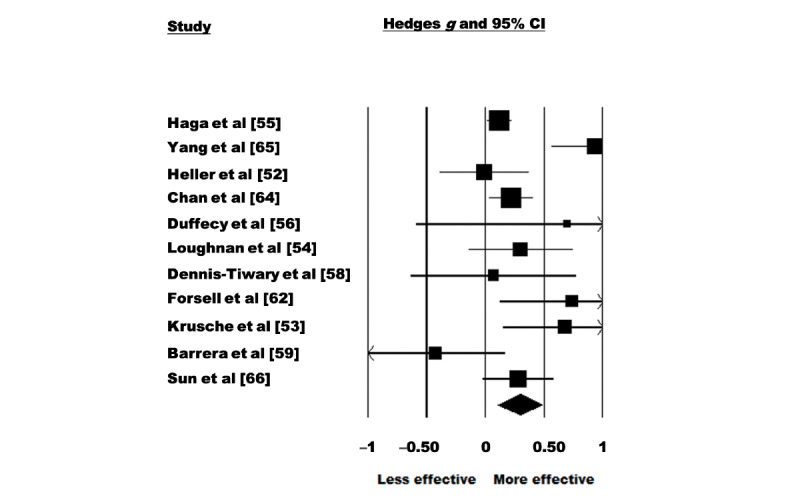
. 2022 Feb 21;9(2):e31116. doi: 10.2196/31116
©Katherine A Silang, Pooja R Sohal, Katherine S Bright, Jennifer Leason, Leslie Roos, Catherine Lebel, Gerald F Giesbrecht, Lianne M Tomfohr-Madsen. Originally published in JMIR Mental Health (https://mental.jmir.org), 21.02.2022.
This is an open-access article distributed under the terms of the Creative Commons Attribution License (https://creativecommons.org/licenses/by/4.0/), which permits unrestricted use, distribution, and reproduction in any medium, provided the original work, first published in JMIR Mental Health, is properly cited. The complete bibliographic information, a link to the original publication on https://mental.jmir.org/, as well as this copyright and license information must be included.

