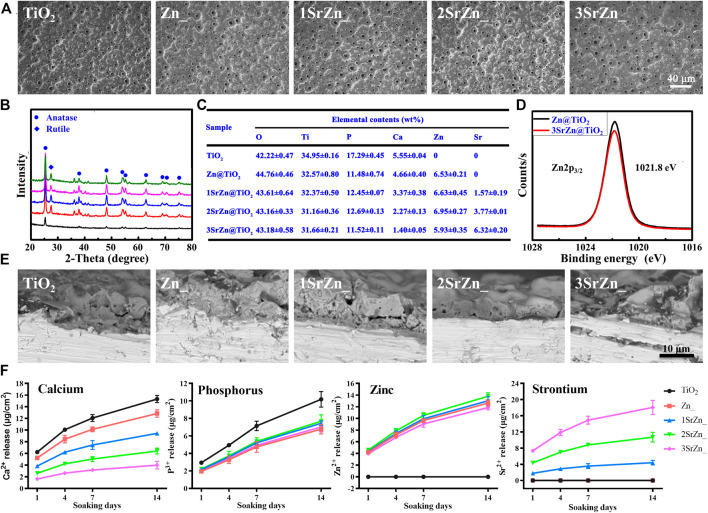
FIGURE 3.
Materials characterization. (A) SEM images of the surface microstructure of pure TiO2 and Zn and/or Sr-doped TiO2 samples after PEO treatment. (B) XRD spectra of the samples. (C) EDS mapping of the major elements in the coatings of the samples. (D) XPS spectra of Zn2p3/2. (E) SEM images showing the cross section of the samples. (F) ICP-MS determination of Ca, P, Sr, and Zn ions released from samples after 1, 4, 7, and 14 days.

