FIGURE 7.
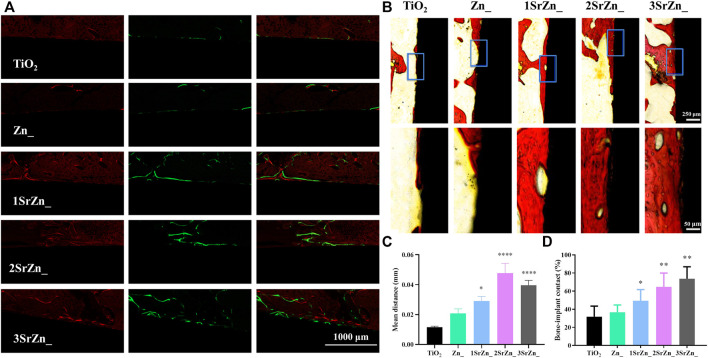
In vivo osseointegration. (A) Bone formation and deposition around the implant samples by polychrome sequential fluorescent labeling method; listed from left to right: alizarin red labeling (red) at 2 weeks and calcein (green) at 6 weeks after surgery of bone tissue and the merged image. (B) Van Gieson’s staining of the sections from rats at 8 weeks after implant surgery. (C) The mean distance between the two labeling lines of alizarin red and calcein (red and green) in (A) was calculated by ImageJ compared with the TiO2 group.(D) Quantification of the bone implant contact (BIC) level of the staining in (B) compared with the TiO2 group.

