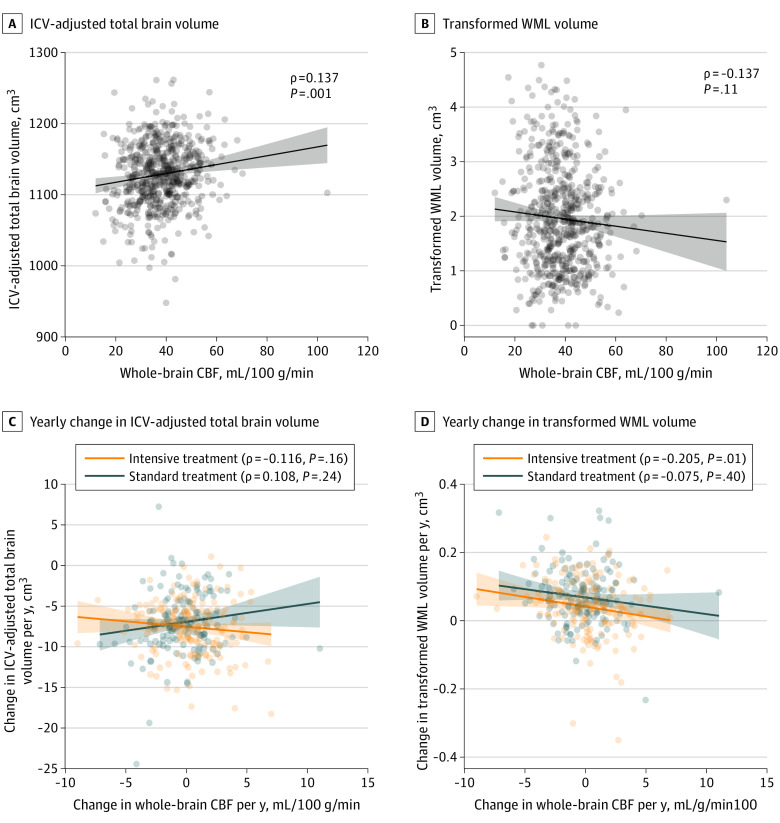
Figure 2. Baseline and Longitudinal Associations Between Whole-Brain Cerebral Blood Flow (CBF), Total Brain Volume, and Cerebral White Matter Lesions (WML).
Rho denotes partial rank correlation coefficient adjusting for age, sex, and magnetic resonance imaging facility. Lines denote estimated least-squares regression line with corresponding 95% CI. WML volumes presented using inverse hyperbolic sine transformation, f(x) = log(x + [x2 + 1]0.5). ICV indicates intracranial volume.

