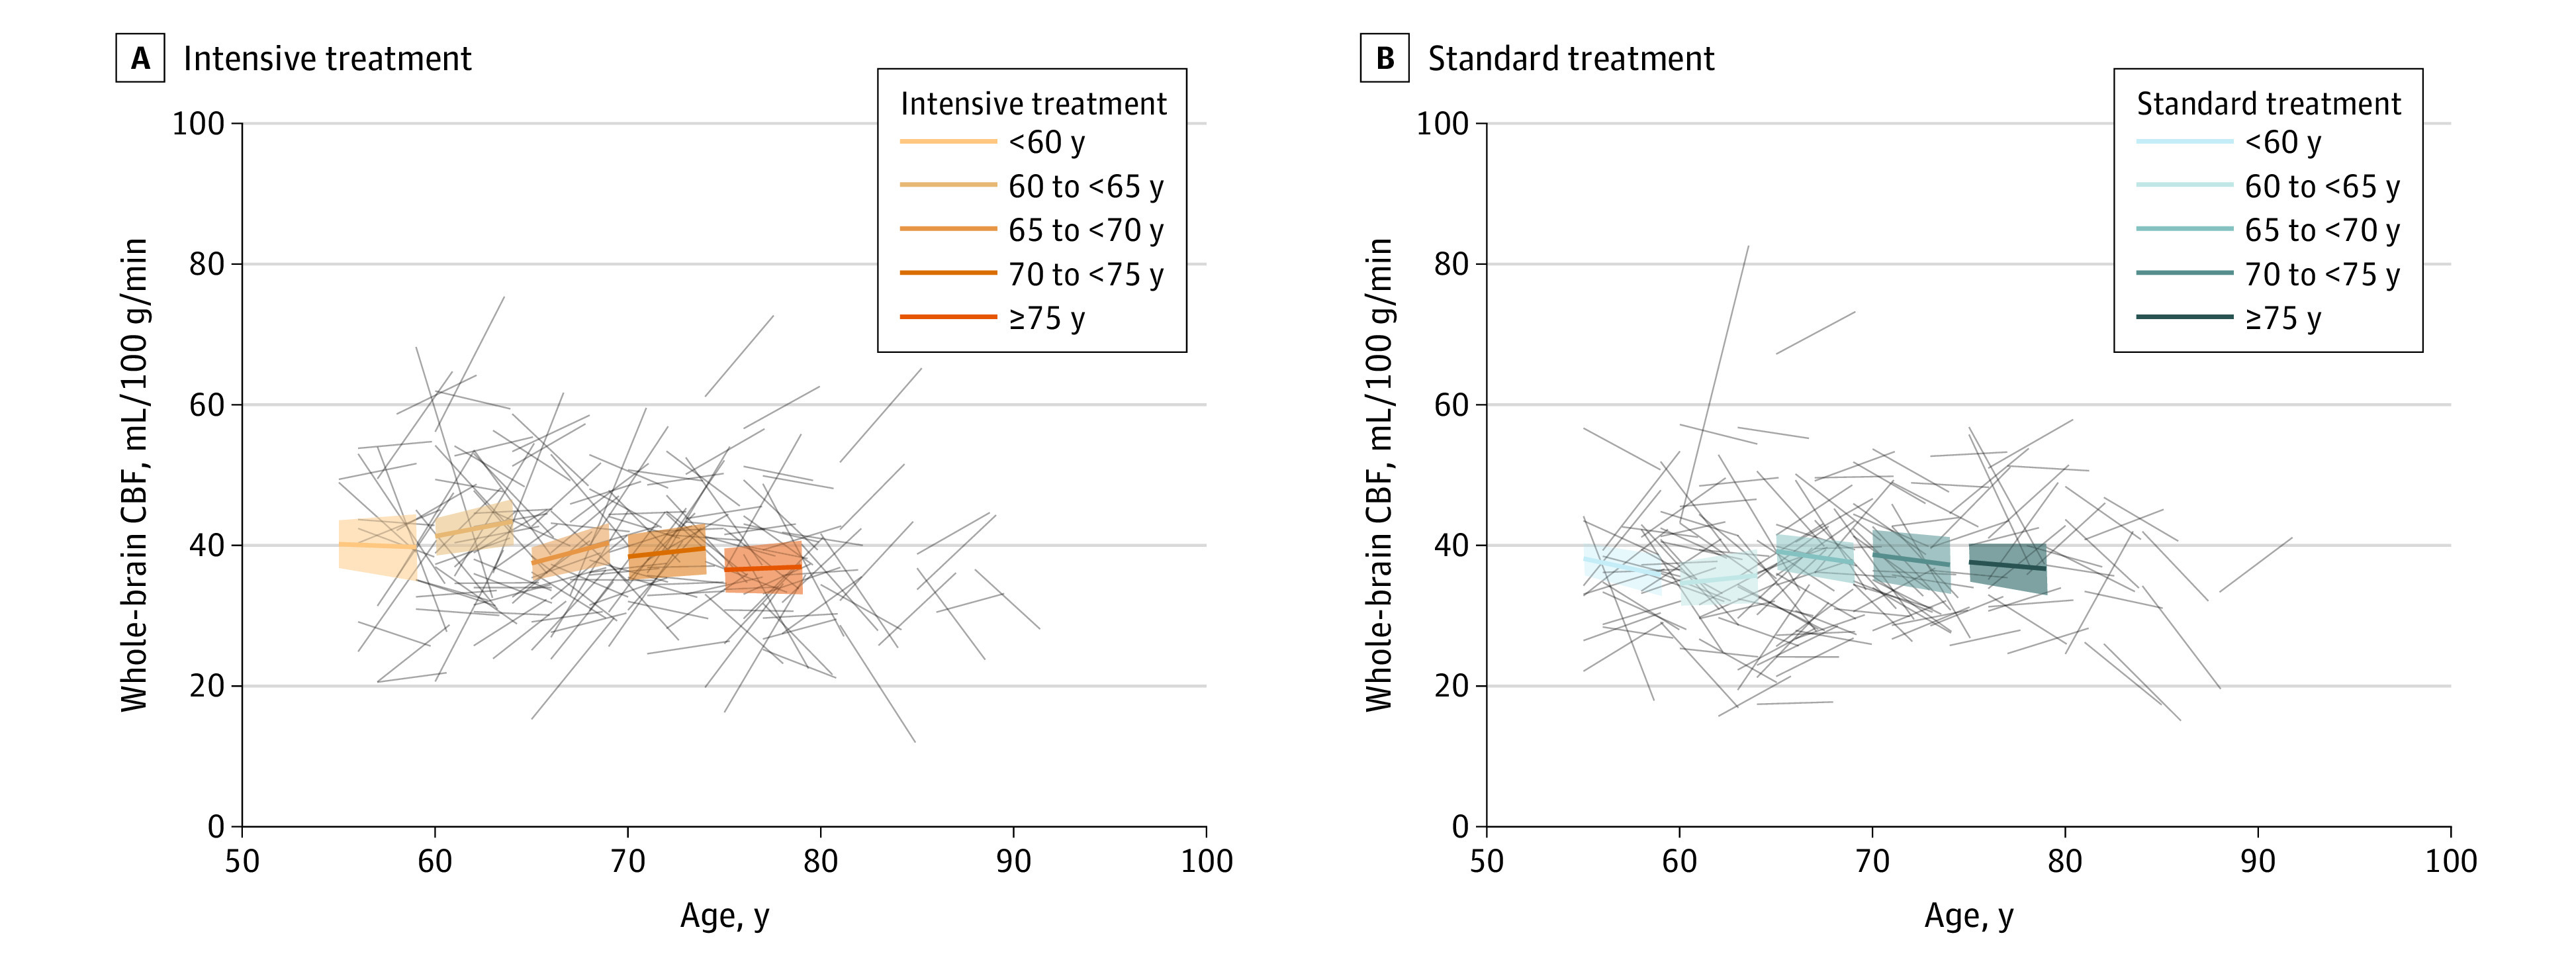
Figure 3. Longitudinal Change in Whole-Brain Cerebral Blood Flow (CBF) by Age and Treatment Group.

Bold colored lines represent age-specific change in whole-brain CBF estimated from a treatment group–specific linear mixed model, with associated 95% CIs. Gray lines represent individual participant trajectories.
