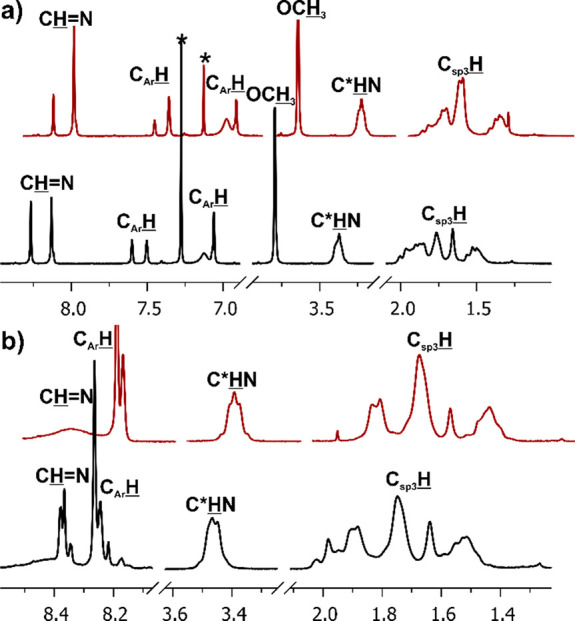
Figure 1.

Example of 1H NMR spectra of isotrianglimines (a) 3c and (b) 3d (anhydrous CDCl3, 300 MHz, 20 °C) measured for the crude products of reactions conducted at an elevated temperature (black lines) and for freshly dissolved crystals of the [3 + 3] products (red lines). Asterisks indicate trace solvent peaks.
