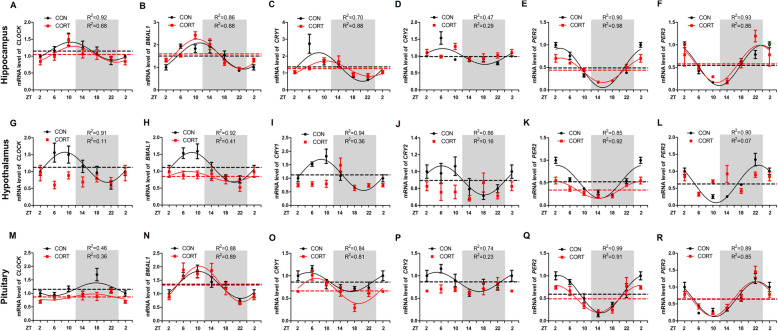
Fig. 2.
Effect of chronic CORT exposure on the circadian rhythm parameters of clock genes in chicken hippocampus, hypothalamus and pituitary. (A-F) The circadian rhythms of clock gene mRNA expression in chicken hippocampus. (A) CLOCK gene; (B) BMAL1 gene; (C) CRY1 gene; (D) CRY2 gene; (E) PER2 gene; (F) PER3 gene. (G-L) The circadian rhythms of clock gene mRNA expression in chicken hypothalamus. (G) CLOCK gene; (H) BMAL1 gene; (I) CRY1 gene; (J) CRY2 gene; (K) PER2 gene; (L) PER3 gene. (M-R) The circadian rhythms of clock gene mRNA expression in chicken pituitary. (M) CLOCK gene; (N) BMAL1 gene; (O) CRY1 gene; (P) CRY2 gene; (Q) PER2 gene; (R) PER3 gene. The relative mRNA levels of clock gene are normalized to PPIA. The data markers in the graphs indicate the clock gene mRNA expression levels, and the results are expressed as the mean ± SEM. The curves represent the 24-h period determined by cosinor analysis. n = 6 chickens per time point. Data from CT2 are double-plotted. R2 values represent the degree of fitting

