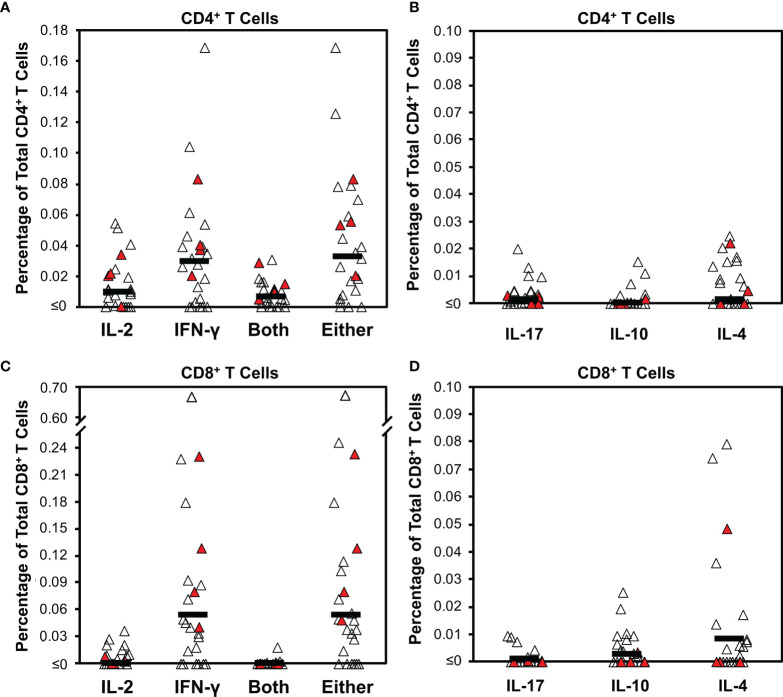
Figure 1.
Intracellular cytokine staining for T cell responses against SARS-CoV-2 early after infection demonstrates bias for IFN- γ production. Cytokine production was determined by intracellular cytokine staining for CD4+ and CD8+ T cell subsets after stimulation with a pool of overlapping peptides spanning spike combined with predicted CD4+ epitopes from across the proteome ( Supplementary Figure S1 ) for 25 persons (21 with mild infection, 4 with severe infection) a mean of 29.8 days from COVID-19 symptom onset (range 15 to 49 days). Filled symbols indicate persons who had severe infection. (A) The background-subtracted frequencies of CD4+ T cells producing IL-2, IFN-γ, both cytokines, or either cytokine are plotted. Dark horizontal bars indicate means, which were 0.010%, 0.030%, 0.007%, and 0.033%, respectively. Defining responses as being ≥0.01% above background, responders for these four cytokine response groupings were 12/25 (48%), 17/25 (68%), 10/25 (40%), and 18/25 (72%), respectively. (B) The background-subtracted frequencies of CD4+ T cells producing IL-17, IL-10, or IL-4 are plotted. Dark horizontal bars indicate means, which were 0.003%, 0.002%, and 0.007%, respectively. Defining responses as being ≥0.01% above background, responders for these three cytokine responses were 3/26 (11.5%), 2/26 (7.7%), 10/25 (40%), and 7/26 (26.9%), respectively. (C) The background-subtracted frequencies of CD8+ T cells producing IL-2, IFN-γ, both cytokines, or either cytokine are plotted. Dark horizontal bars indicate means, which were 0.001%, 0.053%, 0.000%, and 0.054%, respectively. Defining responses as being ≥0.01% above background, responders for these four cytokine response groupings were 6/25 (24%),17/25 (68%), 1/25 (4%), and 20/25 (80%), respectively. (D) The background-subtracted frequencies of CD8+ T cells producing IL-17, IL-10, or IL-4 are plotted. Dark horizontal bars indicate means, which were 0.002%, 0.004%, and 0.012% respectively. Defining responses as being ≥0.01% above background, responders for these three cytokine responses were 0/26 (0%), 3/26 (11.5%), 10/25 (40%), and 6/26 (23.1%), respectively.

