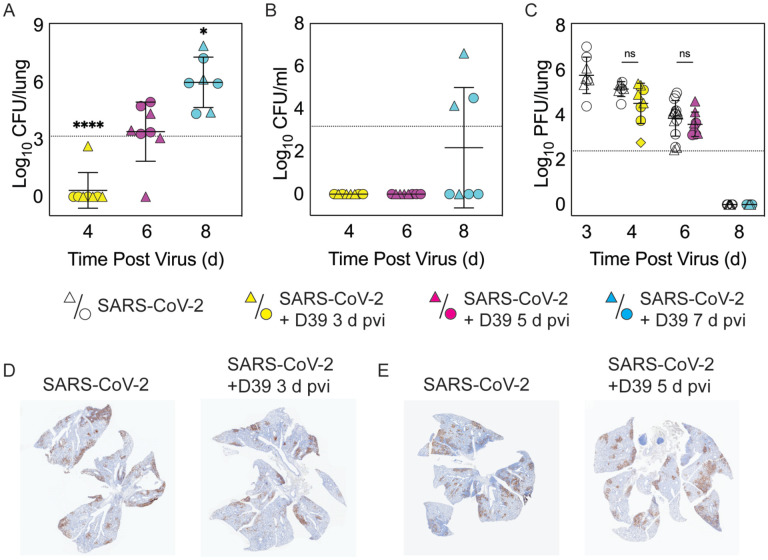
Figure 2: Dynamics of pathogen loads during SARS-CoV-2 infection and pneumococcal coinfection.
Lung bacterial loads (CFU/lung) (A), blood bacterial loads (B), and lung viral loads (PFU/lung) (C) in female (circles) and male (triangles) mice infected with SARS-CoV-2 (250 PFU; white) followed by infection with 103 CFU D39 at 3 d (yellow), 5 d (magenta), or 7 d (cyan) pvi. Each symbol represents a single mouse and the mean ± standard deviation (SD) are for combined male and female groups. Significant differences are indicated by ns, not significant; *, P < 0.05; ***, P < 0.0001. For bacterial titers, comparison was with the inoculum (dotted line). (D-E) Representative immunohistochemical staining of SARS-CoV-2 nucleocapsid protein in the lungs of mice 24 h after they were infected with SARS-CoV-2 (250 PFU) ± 103 CFU D39 at 3 d (D) or at 5 d (E) pvi.

