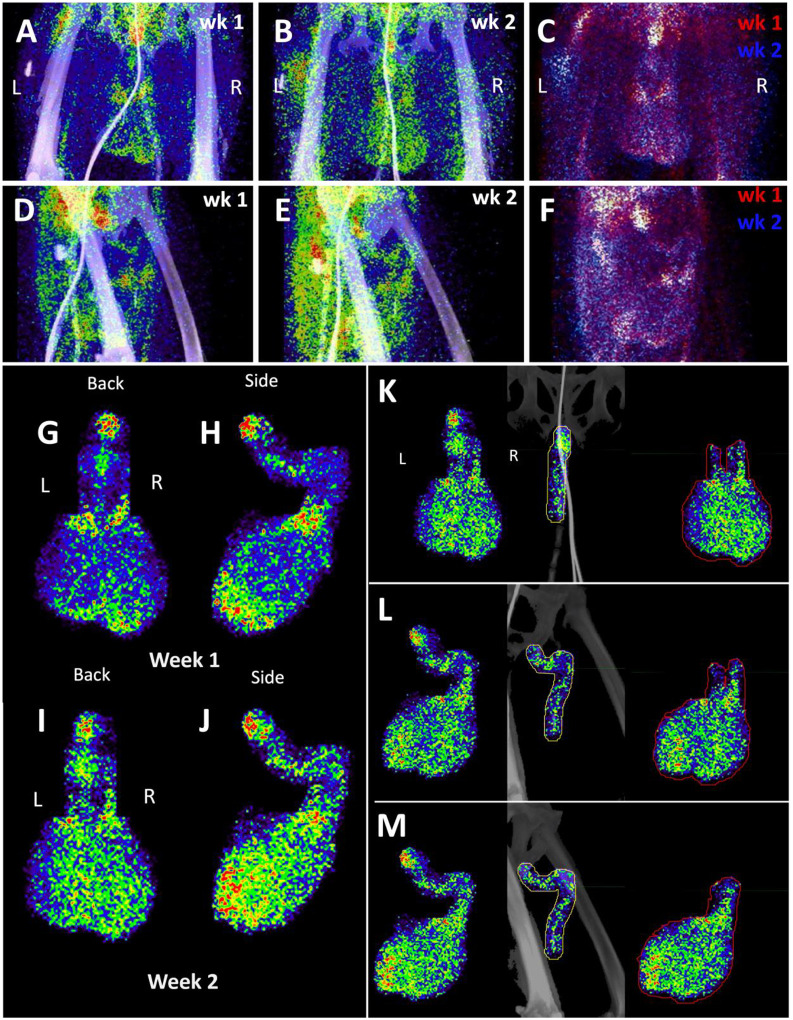
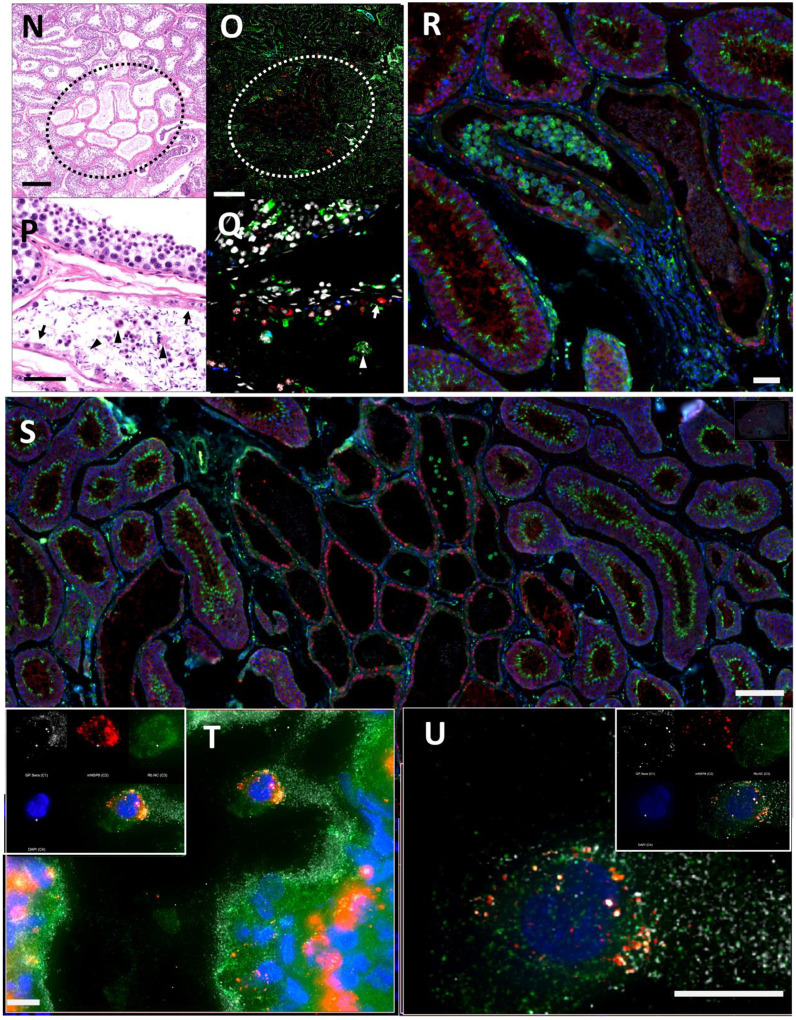
Figure 10. Male genital tract signal in JF82.
(A and B) Front view PET/CT images highlighting the lower abdomen of JF82 at 1-week (A) and 2-weeks (B). (C) Overlay of week 1 (shown in red) and week 2 (shown in blue) PET signal. (D and E) Side view of same images shown in A and B. (F) side view of overlay shown in C. (G and H) Isolated MGT volume from week 1 scan. Back (G) and side (H) views shown. (I and J) Isolated MGT volume from week 2 scan. Back (I) and side (J) views shown. (K, L, and M) Isolated MGT volume from week 2 with isolated penile and testicular signal. Back (K), rotated 45° (L), and side (M) views shown. (N) H&E stain of JF82 testicular tissue. Degenerate seminiferous tubules highlighted in black oval. Scale bar 500 μM. (O) Fluorescent microscopy shows a similar area of degenerate tubules. Green is CD206, red caspase 3, and white nuclear stain. Scale bar 500 μM. (P) Higher magnification image of degenerate tubules. Intraluminal macrophages (arrowheads) and Sertoli cells (arrows) are shown inside tubules. Scale bar 50 μM (Q) Higher magnification of image in O shows Sertoli cells (arrow) staining with caspase 3 and macrophages (arrowhead) staining with CD206. Scale bar 50 μM. (R) Fluorescent microscopy image showing degenerate tubule full of intraluminal macrophages. Red is caspase 3, green is CD206, and blue is nuclear stain. Scale bar 50 μM. (S) Lower magnification microscopy image of degenerate and healthy tubules. Red is caspase 3, green is CD206, and blue is nuclear stain. Scale bar 200 μM. (T and U) Fluorescent microscopy images of infected cells in testicular tissue of JF82. White is SARS-CoV-2 anti-sera, red is NSP8, green is nucleocapsid, and blue is Hoechst nuclear stain. Insets show individual channels, larger image is merge. Scale bars 10 μM.


