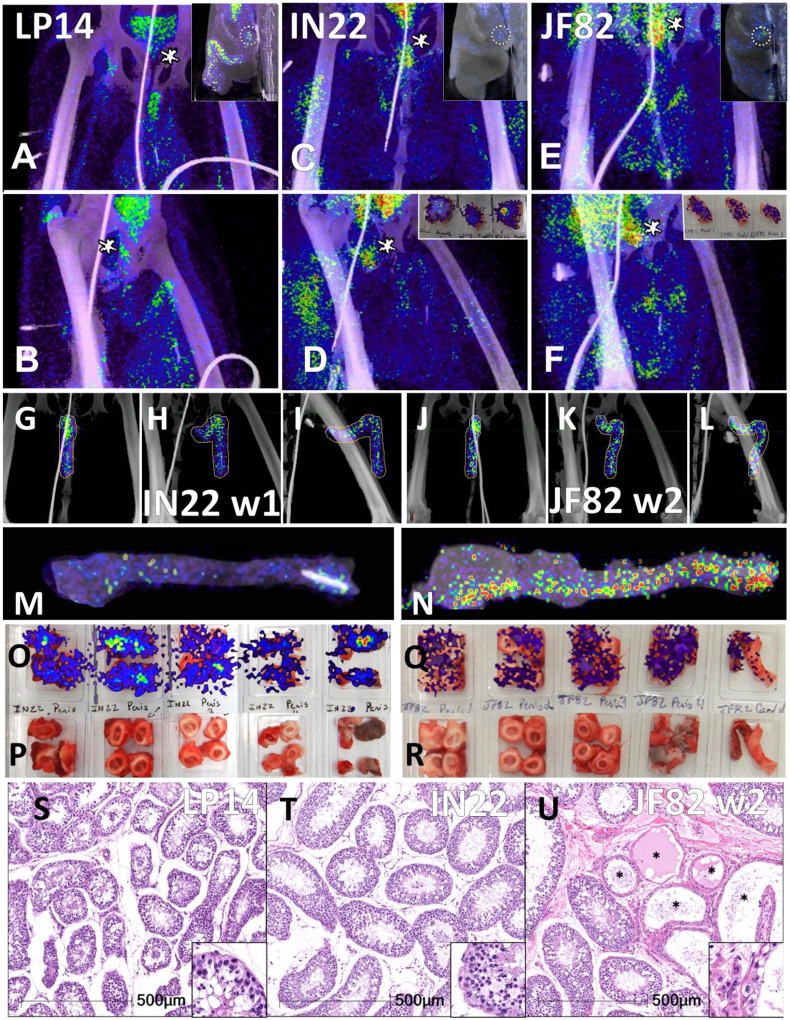
Figure 12. Comparison of prostate and penile signal between animals.
(A-F) PET/CT signal in lower abdomen for each animal at 1-week post-infection. LP14 front (A) and rotated 45° (B), IN22 front (C) and rotated 45° (D), JF82 front (E) and rotated 45° (F). Asterisks mark location of prostate. Insets show sagittal z-slice of each animal highlighting prostate signal (white circle). (G-I) PET/CT volume of penis for IN22. Front (G), rotated 45° (H), and side (I) views shown. (J-L) PET/CT volume of penis for JF82 at 2-weeks post-infection. Front (J), rotated 45° (K), and side (L) views shown. (M) PET/CT signal of IN22 penis after necropsy. (N) PET/CT signal of JF82 penis after necropsy. (O) PET/CT signal overlaid onto an image of tissue cassettes (P) containing penile tissue of IN22. (Q) PET/CT signal overlaid onto an image of tissue cassettes (R) containing penile tissue of JF82. (S-U) H&E images of testicular tissue from each animal. LP14 (S) and IN22 (T) shows normal spermatogenesis and tissue architecture. IN22 (U) shows degenerate tubules (asterisks) interspersed among healthy tubules. Scale bars all 500 μM.

