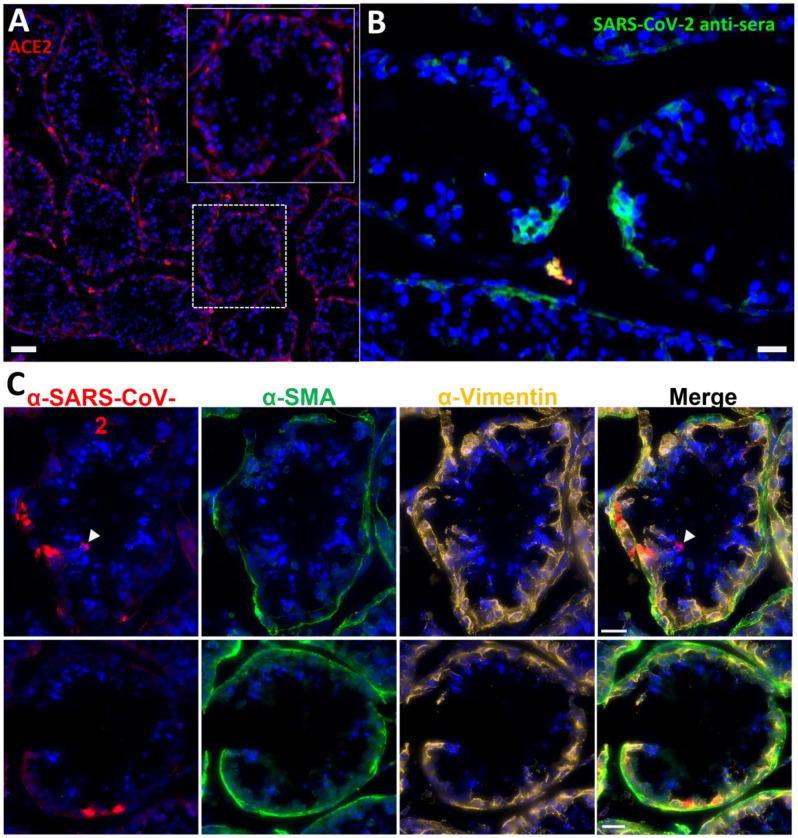
Figure 4. Immunofluorescence of LP14 Testes.
(A) Fluorescent microscopy image of LP14 seminiferous tubules. ACE2 staining shown in red, Hoechst nuclear staining shown in blue. Inset shows zoom in of single tubule to better view ACE2 staining in Sertoli and myoid cells. Scale bars 50 μM. (B) Fluorescent microscopy image of LP14 testis shows infected cells. SARS-CoV-2 anti-sera staining in green, background fluorescent in red, and Hoechst nuclear staining in blue. Scale bars 25 μM. (C) Microscopy images of two tubules containing infected cells (top and bottom rows). Red is SARS-CoV-2 anti-sera, green is smooth muscle actin, gold is vimentin, and blue is Hoechst nuclear stain. Possible infected germ cells marked by arrow heads. Scale bars 20 μM.

