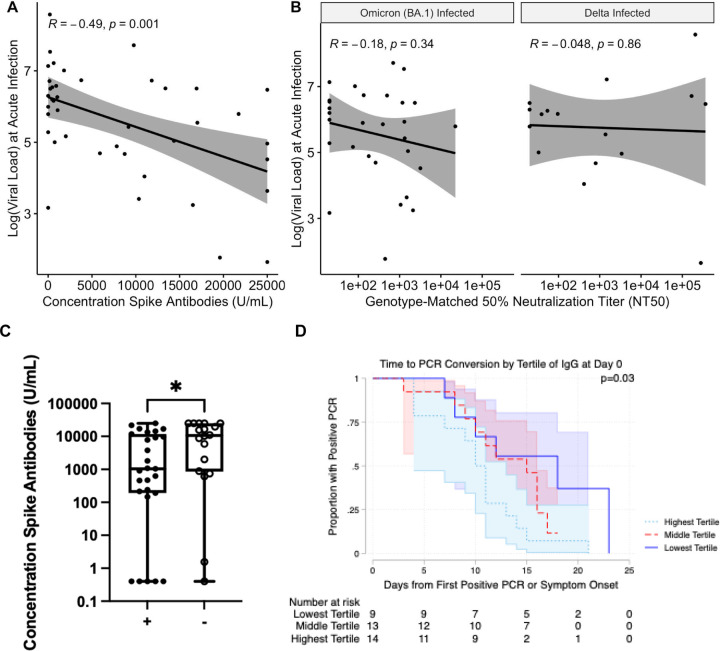
Figure 1:
A. The logarithm of viral load at the time of infection vs the concentration of anti-Spike antibodies at the time of breakthrough. A regression line with standard error is shown, with the Pearson correlation coefficient and corresponding p value. B. Genotype-matched neutralizing antibody titers. A regression line with standard error is shown, with the Pearson correlation coefficient and corresponding p value. C. Anti-Spike antibody concentration at the initial study visit for culture-positive cases (+) and culture negative cases (−). Significance according to an unpaired Wilcoxon rank-sum test is shown. * − p < 0.05. D. Kaplan-Meier curves for time to PCR conversion by tertile of anti-Spike responses. The P-value represents log-rank testing comparing the subgroups.

