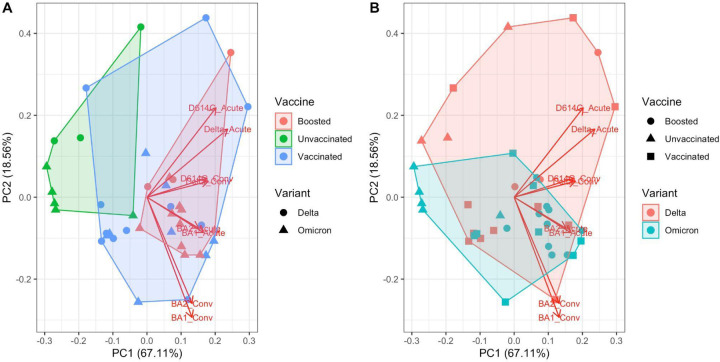
Figure 3:
Principal component analysis of NT50 titers. The loadings are plotted as arrows. A. The convex hull of the clusters according to vaccination status is shaded. Point shape denotes the infecting variant. B. The convex hull of the clusters according to the infecting variant is shaded. Point shape denotes vaccination status at the time of infection.

