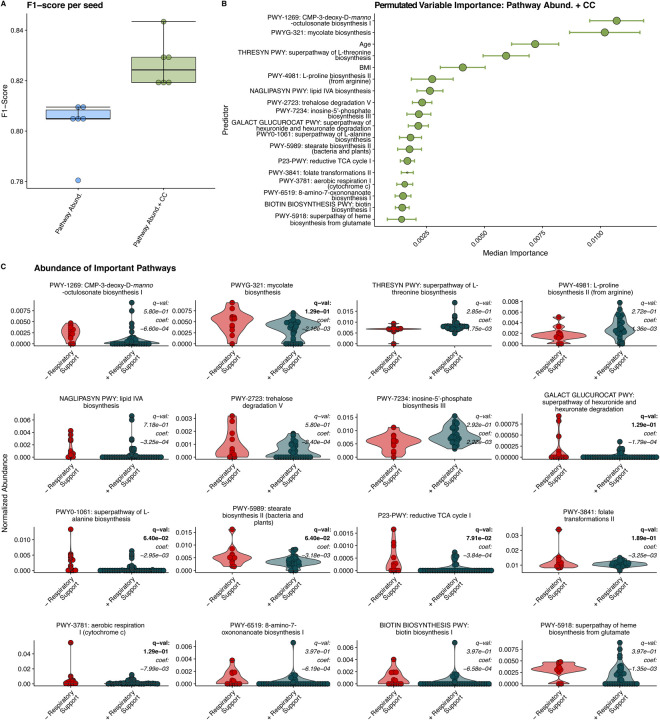
Figure 3. Random Forest Classification Using Metabolic Pathways.
A) F1 scores of RFC models built on relative abundance of detected metabolic pathways and clinical covariates (CC). B) Median relative importance of variables in predicating the need for respiratory support within the trained with relative pathway abundances and clinical covariates (median importance ± median absolute deviation). C) Relative abundance of detected metabolic pathways in individuals requiring respiratory support and those not requiring respiratory support. MaAsLin2 derived q-values and coefficients are displayed for each pathway. Significant q values (q < 0.25) are bolded.

