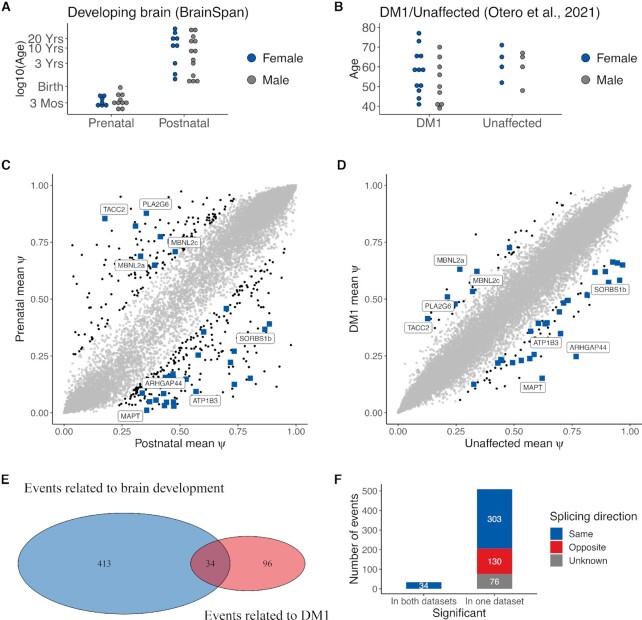
Figure 1.
A quarter of the aberrant splice events in adult DM1 brains are associated with brain development. (A) Overview of the developmental stage of 39 healthy donors in the BrainSpan dataset. In total, the donors provided 139 RNA-Seq samples from four subregions of the frontal cortex. (B) Overview of the DM1 dataset from Otero et al. (2021) containing RNA-Seq samples from the frontal cortices of 21 DM1 adult patients and 8 unaffected controls. (C) Scatter plot of mean Ψ in prenatal (y-axis) and postnatal (x-axis) samples for all measured splice events in the developmental dataset. The 447 splice events with significant differences between groups (|ΔΨ| > 0.2, P < 0.01 by rank-sum test) are in black. Events shaped as a blue-colored square were significantly different in both datasets and those with the largest mean ΔΨ in the DM1 dataset are labeled by their name (see also Figure 2). (D) Scatter plot of mean Ψ in DM1 (y-axis) and healthy (x-axis) samples for all splice events measured in the DM1 dataset. The 130 splice events with significant differences between groups (|ΔΨ| > 0.2, P < 0.01 by rank-sum test) are in black. Further labeling also as in (C). (E) Venn diagram of splice events that featured a marked and significantly different change (|ΔΨ| > 0.2, P < 0.01 by rank-sum test) between prenatal and postnatal samples (i.e. related to brain development), and between DM1 and unaffected samples (i.e. related to DM1). (F) Histogram of splice events significantly altered in both the BrainSpan and the DM1 datasets (left bar) of in just one of the datasets (right bar). The splicing direction indicates whether exon inclusion increased or decreased in the same or opposite direction when comparing the DM1 and prenatal group to the unaffected and postnatal group. The direction of change for some events is marked as ‘unknown’ due to missing data in one of the datasets. Here, events were considered significant when P < 0.01 by rank-sum test in both datasets. The 34 high-confidence events all show the same direction of change.

