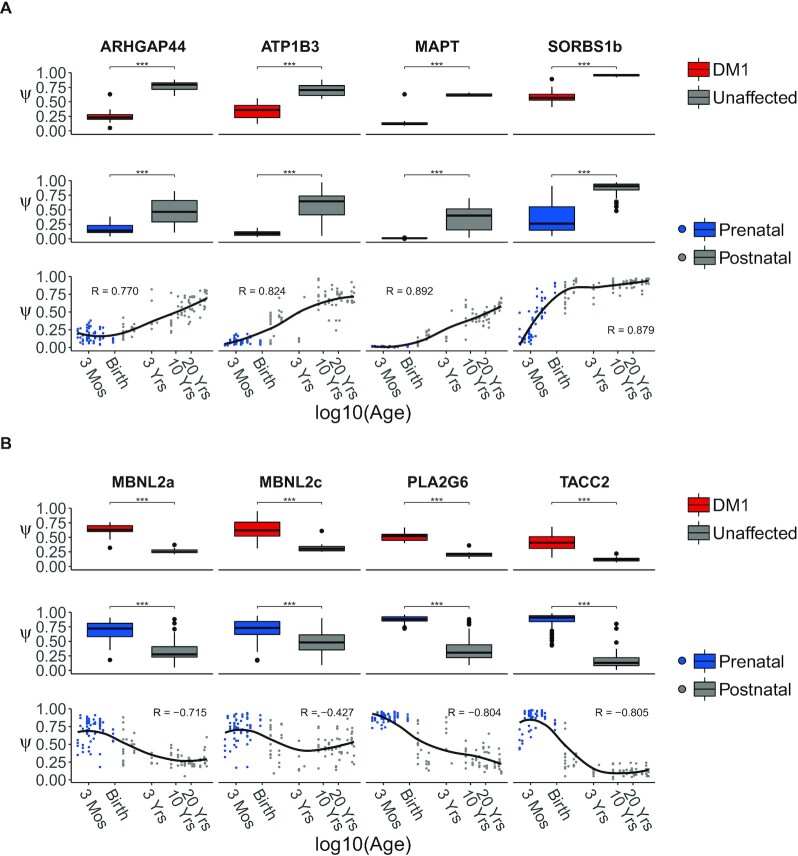
Figure 2.
Splice events with strongest up- and downregulation in DM1 show gradual change through development. Splice events with the largest decrease (A) or increase (B) in Ψ in DM1 patients compared to unaffected adults. The top rows in panels (A) and (B) show boxplots of Ψs for events selected for the largest difference in mean Ψ between frontal cortex samples from DM1 patients (in red) and unaffected adults (in gray). The boxplots in the middle rows are based on frontal cortex samples from healthy prenatal (in blue) and postnatal donors (in gray). All samples collected before and after birth were pooled to form the prenatal and postnatal groups, respectively. A significant difference between groups was assessed by the rank-sum test. P-values were FDR-corrected with the Benjamini–Hochberg procedure (ns: P > 0.05, ***: P < 0.001). The bottom row shows scatterplots of Ψ for the selected events in the healthy, developing human frontal cortex. Post-conceptional age was recorded in days and plotted on a log10 scale. Arbitrary x-axis labels were chosen to highlight specific timepoints during development (Mos = Months, Yrs = Years). The regression curve was estimated by the LOESS method.

