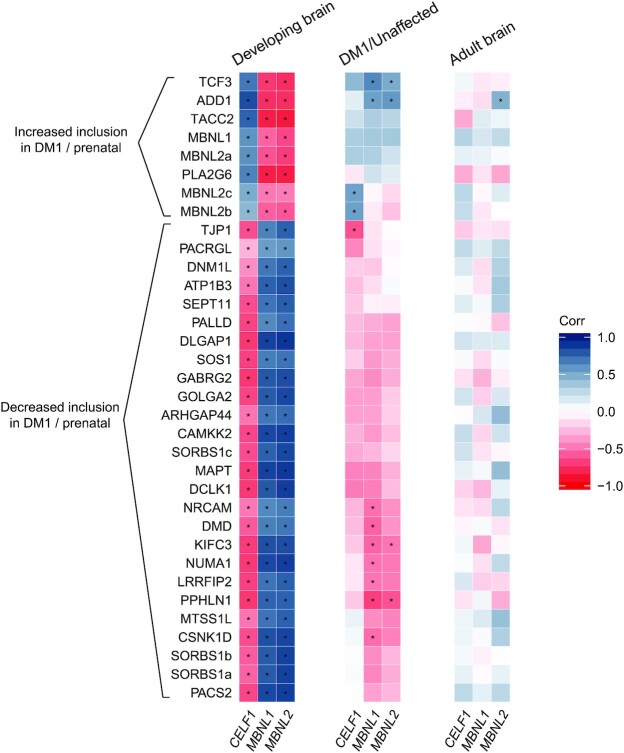
Figure 4.
Correlation of alternative splicing and RNA expression of CELF1, MBNL1 and MBNL2. Correlations were computed between Ψ of high-confidence exon skipping events and RNA expression levels of CELF1, MBNL1 and MBNL2 within the same samples from the healthy, developing frontal cortex (left), from the frontal cortex of DM1 patients and unaffected adults (middle) and from the healthy, adult frontal cortex (right). The splice events are hierarchically clustered based on the average distance between the correlations for the DM1/unaffected samples. The color scale on the right reflects the value of the Spearman’s rank correlation coefficient. Asterisks indicate a significant correlation (per study FDR-corrected P < 0.05).

