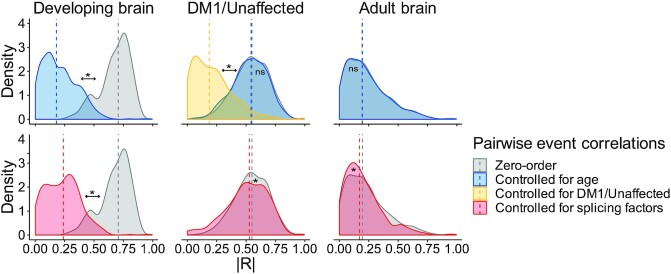
Figure 5.
Pairwise correlations of splice events are partially explained by age differences and splicing factor RNA expression in the developing frontal cortex but not in the DM1 or unaffected adult frontal cortex. Pairwise (cross-) correlations were computed between the Ψ of all 34 high-confidence splice events. The density plots show the distribution of the absolute Spearman’s rank correlation coefficients for frontal cortex samples from the healthy, developing brain (left), from DM1 patients and unaffected adults (middle) and from the healthy, adult brain (right). Zero-order (i.e. uncorrected) pairwise correlations (in gray) were separately controlled for the following variables: age of the sample donor (in blue), disease state (DM1 or unaffected; in yellow) or RNA expression of CELF1, MBNL1 and MBNL2 (in red). Differences between zero-order distributions and their corrected counterparts were assessed by the rank-sum test. P-values were FDR-corrected with the Benjamini–Hochberg procedure (ns: P > 0.05, *: P < 0.05). The dashed vertical line indicates the median correlation.

