
Fig. 1. DD Mtb undergo oxidative stress.
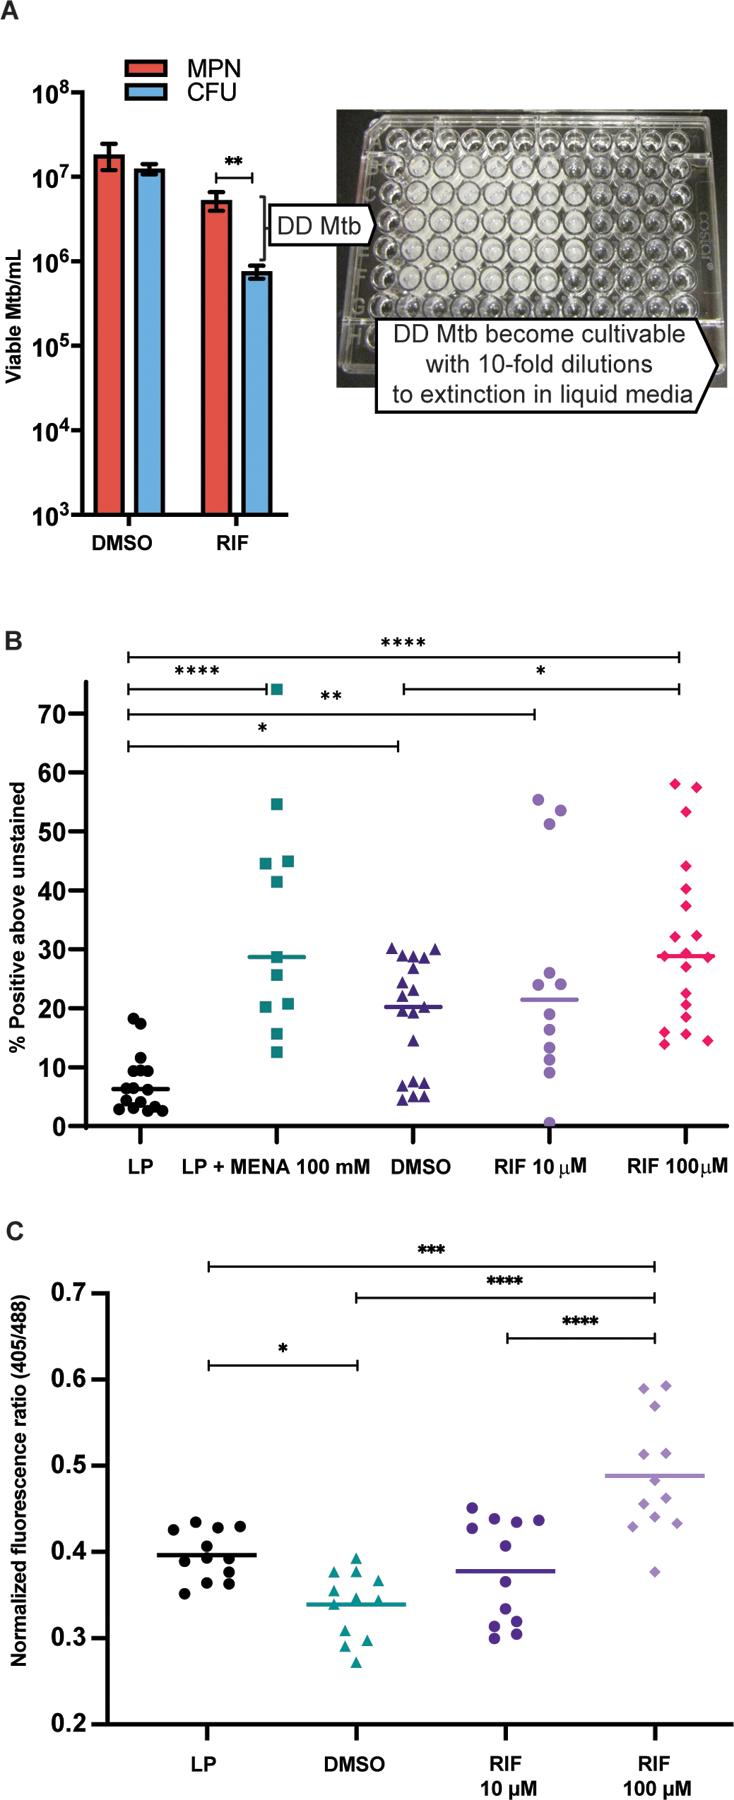
(A) Representative results of DD Mtb estimation in the PBS-RIF in vitro model are shown with photo of a representative liquid limiting dilution assay used for most probable number (MPN) calculations. Mtb cells were starved in PBS for at least 2 weeks, then exposed to either high dose RIF (10 to 100 µM) or DMSO (vehicle control). After washing out the RIF or DMSO, the culture undergoes 10-fold serial dilutions across 5 technical replicates, and the number of positive wells is inputted into an MPN calculator to estimate the original, undiluted concentration of viable cells. Data were analyzed using a mixed effects analysis with Sidak’s multiple comparisons test. (B) Flow cytometry analysis is shown of log phase (LP) Mtb, LP Mtb exposed to 100 mM menadione (LP + MENA), starved then DMSO-exposed Mtb (DMSO; vehicle control), and starved then RIF-exposed Mtb (RIF), after staining with CellROX Green. Data shown are representative of 7 experiments with 1 to 3 biological replicates each, except RIF 10 µM data which are from 4 experiments with 3 biological replicates each. Data were analyzed using a mixed effects analysis with Tukey’s multiple comparisons test. Horizontal bars indicate median. (C) Flow cytometry analysis of Mrx1-roGFP2 plasmid containing H37Rv (6 experiments, 12 biological replicates total) in LP, PBS starved then DMSO or RIF exposed Mtb. Statistics were calculated by one-way ANOVA with Tukey’s multiple comparisons test. Horizontal bars indicate mean. *adj p < 0.05, **adj p < 0.01, ***adj p < 0.001, ****adj p < 0.0001.