
Fig. 2. DD Mtb exhibit widespread damage to DNA, proteins, and lipids.
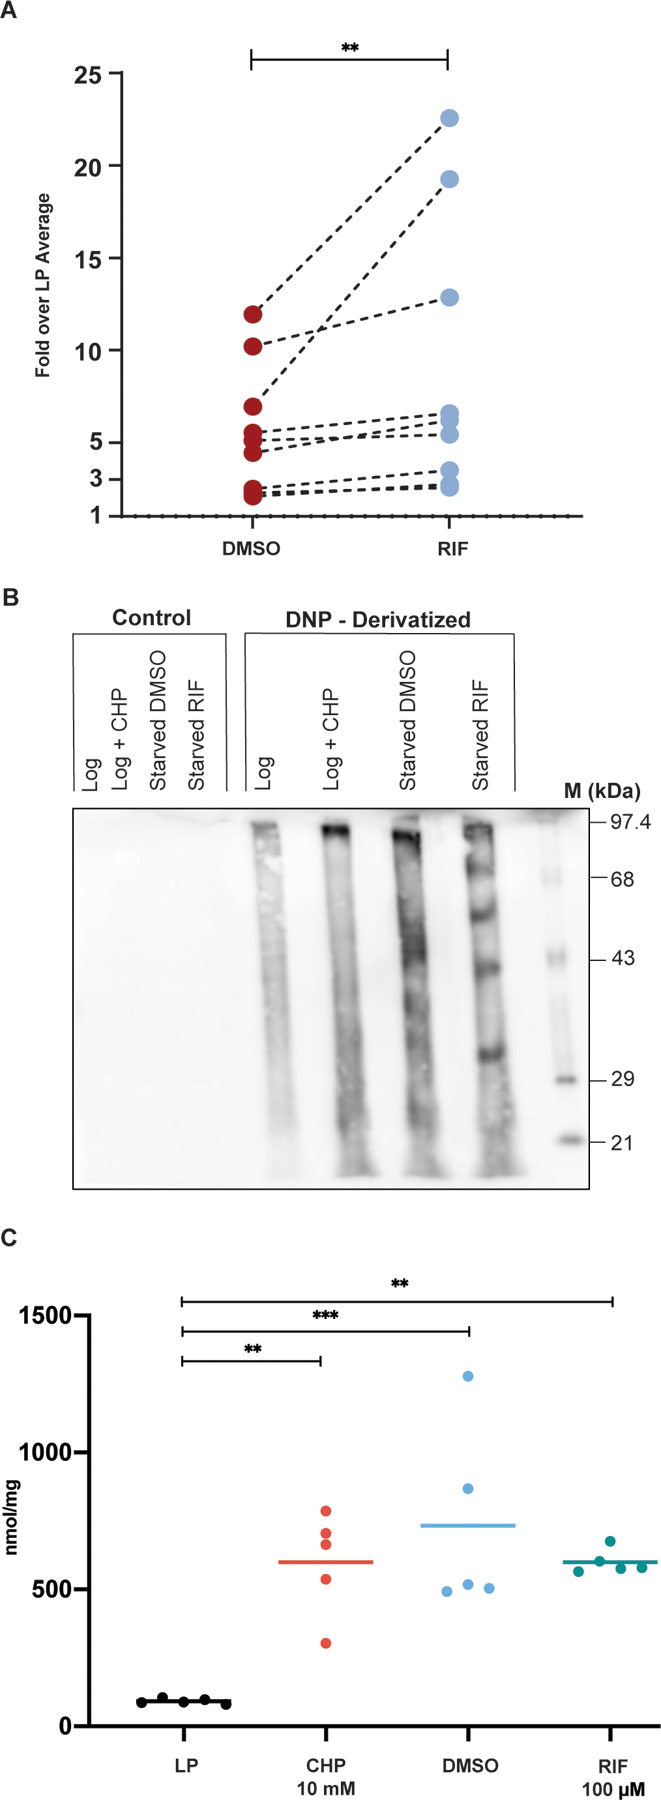
(A) TUNEL assay flow cytometry analysis of starved cells exposed to DMSO or RIF is shown normalized to the average LP percent positive. Data are representative of 3 experiments with 3 biological replicates each. Lines connecting DMSO and RIF indicate arms of the same biological replicate. Data were analyzed using a Wilcoxon matched-pairs signed rank test. **p < 0.01. (B) A representative western blot is shown of Oxyblot detection of carbonyl groups on proteins derivatized by 2,4-dinitrophenylhydrazine (DNPH) from LP cells, LP cells treated with 10 mM cumene hydroperoxide (CHP), and starved cells treated with DMSO or RIF. Control lanes were processed in the same way but lack DNPH. M: DNP-derivatized molecular weight protein standards. (C) Results of a Cayman LPO assay estimating lipid hydroperoxides is shown using lipid extracts prepared from LP cells, LP cells treated with 10 mM CHP, and PBS starved cells treated with DMSO or RIF. Data are representative of 3 experiments with 5 biological replicates total. Data were analyzed using a one-way ANOVA with Tukey’s multiple comparisons test. **adj p < 0.01, ***adj p < 0.001.