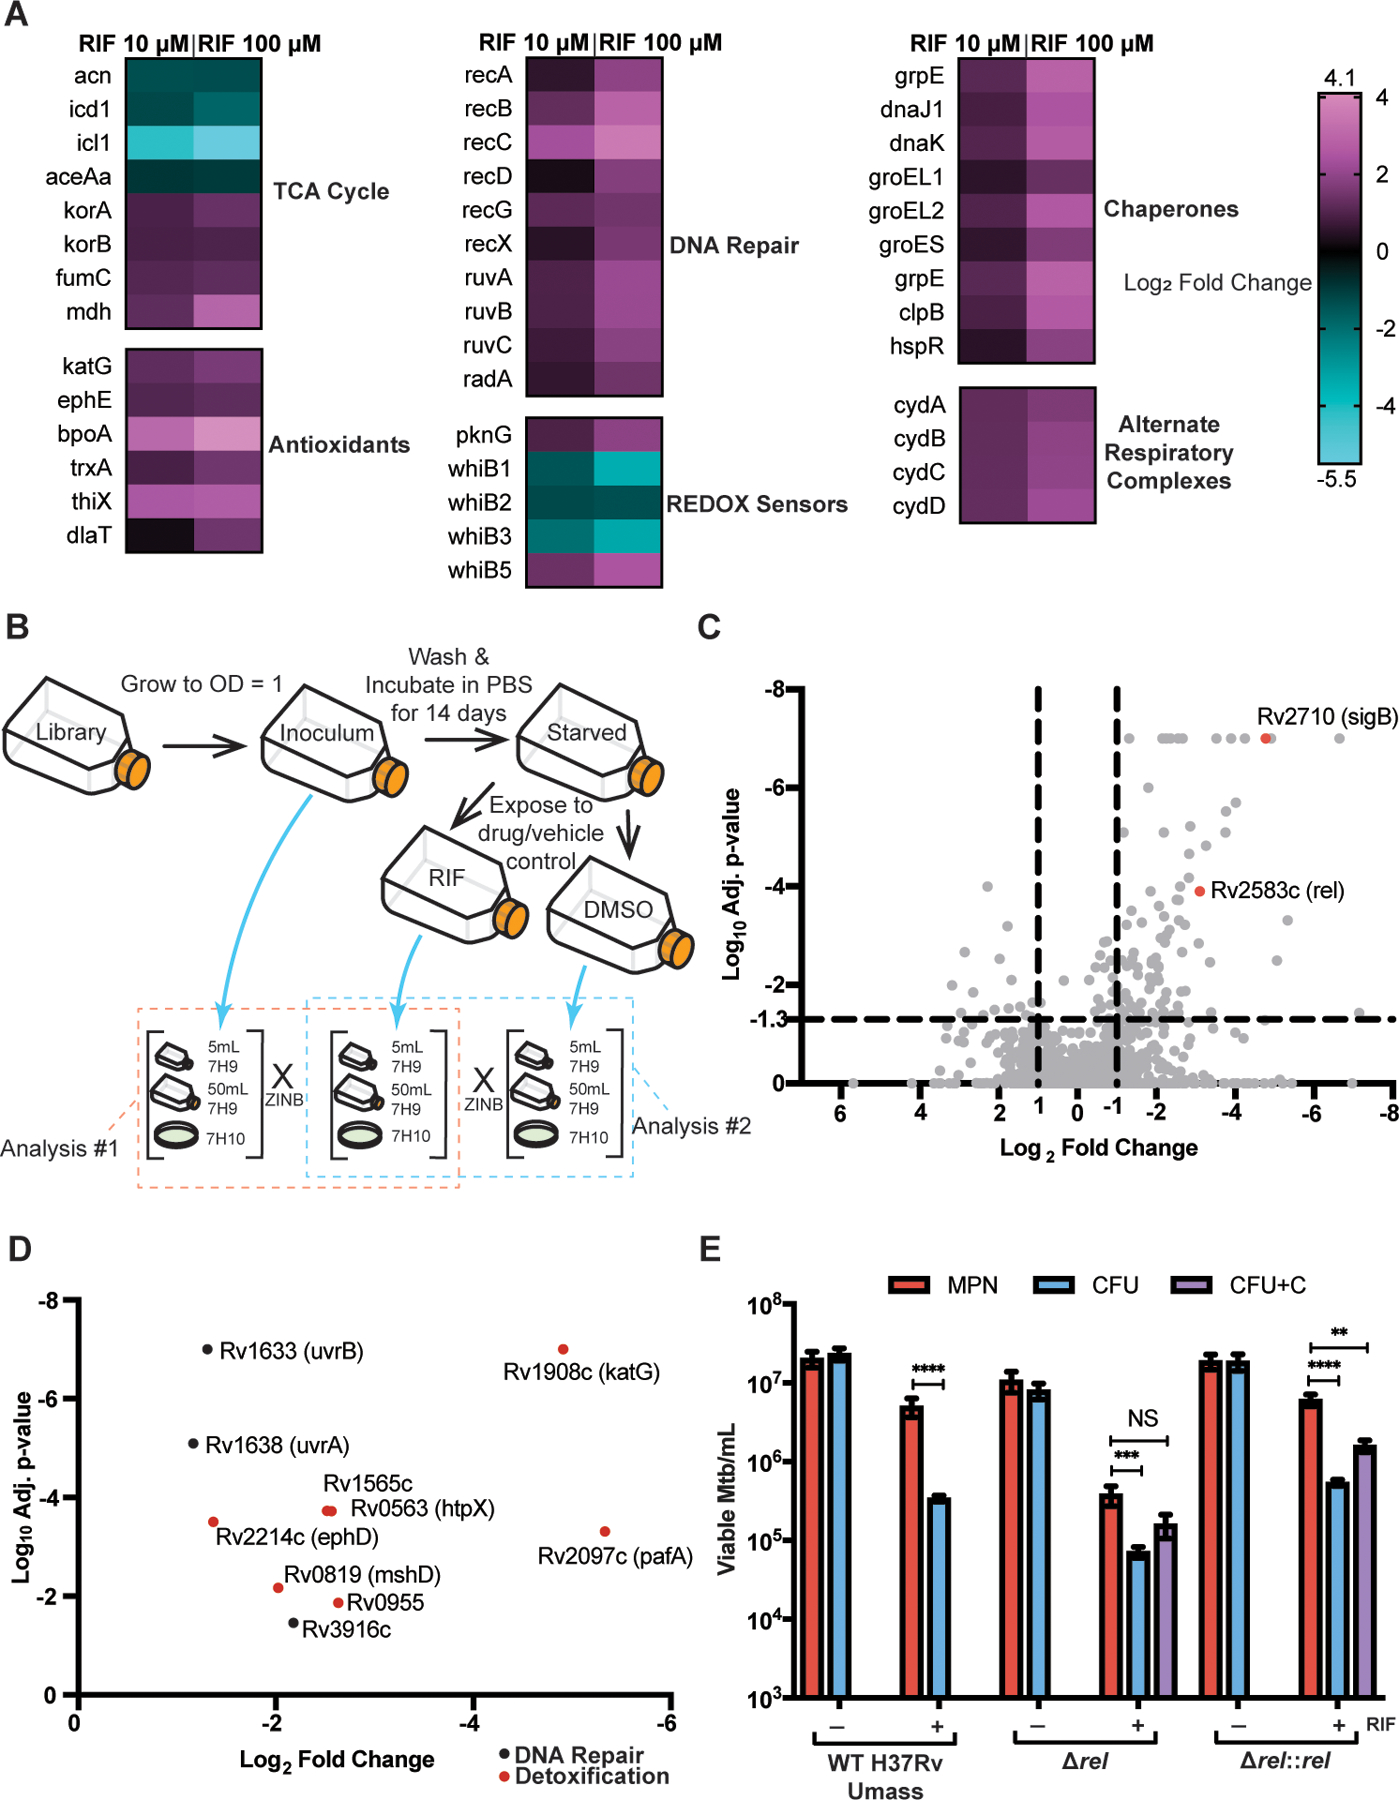
Fig. 3. Characterization of DD Mtb by RNA-sequencing and Transposon-sequencing.

(A) Heat maps of selected significantly upregulated and downregulated genes as compared to vehicle control (DMSO) are shown. Data are representative of 2 experiments with 3 biological replicates each. (B) A schematic for TnSeq experiment and data analysis is shown. ZINB, zero-inflated negative binomial. (C) A volcano plot of transposon mutants depleted in starved, RIF exposed cells is shown as compared to input library. Data are representative of 2 experiments with 1 sample each. (D) Oxidative stress response genes and DNA damage repair genes from (C) are highlighted. (E) Viable cell counts are shown for wild type (WT) H37Rv UMass, ∆rel, and ∆rel::rel after starvation and 5 days of RIF or DMSO exposure. Data are representative of 2 experiments with 3 biological replicates each. CFU+C = CFU grown with charcoal supplementation. Data were analyzed using a mixed-effects analysis with Sidak’s multiple comparisons test. **adj p < 0.01, ***adj p < 0.001, ****adj p < 0.0001; NS, not significant.
